windows_exporter
 windows_exporter copied to clipboard
Performance drop in 0.7.999-preview
@carlpett Hi, I've just tried out this build but am actually seeing a big performance drop compared with 0.6.0? Requests with 0.6.0 are taking around 500ms, whereas 0.7.999-preview2 is taking around 1750-2000ms
I'm running both instances with these arguments:
--collector.textfile.directory="C:\Application\Monitoring\WmiExporter" --telemetry.addr="127.0.0.1:9182" --telemetry.path="/wmi/metrics" --collectors.enabled="cpu,iis,logical_disk,cs,memory,net,os,process,system" --collector.process.processes-where="Name LIKE 'php-cgi%' OR Name LIKE 'w3wp%' OR Name Like 'mysqld'"
I wondered if the process filtering could be an issue, but didn't really see any difference after removing that (and the process collector)
Is there any extra information I can provide?
Originally posted by @petedishman in https://github.com/martinlindhe/wmi_exporter/pull/335#issuecomment-497407090
@petedishman Could you show a comparison of the wmi_exporter_collector_duration_seconds metrics before/after, and also the scrape_duration metric that Prometheus generates internally?
I'm wondering if there could be a bug in the timeout detection such that we actually don't return even though all collectors are finished.
From 0.6.0:
wmi_exporter_build_info{branch="master",goversion="go1.11",revision="517cd3b04b346e3444a0e4ded96b0192dab3f7ed",version="0.6.0"} 1
wmi_exporter_collector_duration_seconds{collector="cpu"} 0.2409994
wmi_exporter_collector_duration_seconds{collector="cs"} 0.2099994
wmi_exporter_collector_duration_seconds{collector="iis"} 0.476998
wmi_exporter_collector_duration_seconds{collector="logical_disk"} 0.0580004
wmi_exporter_collector_duration_seconds{collector="memory"} 0.3649983
wmi_exporter_collector_duration_seconds{collector="net"} 0.3340011
wmi_exporter_collector_duration_seconds{collector="os"} 0.3160001
wmi_exporter_collector_duration_seconds{collector="process"} 0.4119985
wmi_exporter_collector_duration_seconds{collector="system"} 0.3510043
wmi_exporter_collector_success{collector="cpu"} 1
wmi_exporter_collector_success{collector="cs"} 1
wmi_exporter_collector_success{collector="iis"} 1
wmi_exporter_collector_success{collector="logical_disk"} 1
wmi_exporter_collector_success{collector="memory"} 1
wmi_exporter_collector_success{collector="net"} 1
wmi_exporter_collector_success{collector="os"} 1
wmi_exporter_collector_success{collector="process"} 1
wmi_exporter_collector_success{collector="system"} 1
From 0.7.999-preview.2:
wmi_exporter_build_info{branch="timeout-scrapes",goversion="go1.12.3",revision="daa6f3d111ba34a9eb64cdfbe5160192b4566e1a",version="0.7.999-preview.2"} 1
wmi_exporter_collector_duration_seconds{collector="cpu"} 0
wmi_exporter_collector_duration_seconds{collector="cs"} 0.0179999
wmi_exporter_collector_duration_seconds{collector="iis"} 0.4329976
wmi_exporter_collector_duration_seconds{collector="logical_disk"} 0.1409957
wmi_exporter_collector_duration_seconds{collector="memory"} 0.1559959
wmi_exporter_collector_duration_seconds{collector="net"} 0.0519999
wmi_exporter_collector_duration_seconds{collector="os"} 0.2189961
wmi_exporter_collector_duration_seconds{collector="process"} 0.3719989
wmi_exporter_collector_duration_seconds{collector="system"} 0.0340015
wmi_exporter_collector_success{collector="cpu"} 1
wmi_exporter_collector_success{collector="cs"} 1
wmi_exporter_collector_success{collector="iis"} 1
wmi_exporter_collector_success{collector="logical_disk"} 1
wmi_exporter_collector_success{collector="memory"} 1
wmi_exporter_collector_success{collector="net"} 1
wmi_exporter_collector_success{collector="os"} 1
wmi_exporter_collector_success{collector="process"} 1
wmi_exporter_collector_success{collector="system"} 1
wmi_exporter_collector_timeout{collector="cpu"} 0
wmi_exporter_collector_timeout{collector="cs"} 0
wmi_exporter_collector_timeout{collector="logical_disk"} 0
wmi_exporter_collector_timeout{collector="memory"} 0
wmi_exporter_collector_timeout{collector="net"} 0
wmi_exporter_collector_timeout{collector="os"} 0
wmi_exporter_collector_timeout{collector="process"} 0
wmi_exporter_collector_timeout{collector="system"} 0
and side by side:
| collector | 0.6.0 | 0.7.999-preview.2 |
|---|---|---|
| cpu | 0.2409994 | 0 |
| cs | 0.2099994 | 0.0179999 |
| iis | 0.476998 | 0.4329976 |
| logical_disk | 0.0580004 | 0.1409957 |
| memory | 0.3649983 | 0.1559959 |
| net | 0.3340011 | 0.0519999 |
| os | 0.3160001 | 0.2189961 |
| process | 0.4119985 | 0.3719989 |
| system | 0.3510043 | 0.0340015 |
Thanks!
I've been trying to reproduce this, but I'm not seeing the dramatic difference you report. In your report, it seems most collectors are actually responding faster on the preview version.
Is it the scrape_duration_seconds metric that you are looking at to see that it is slower? How is the load on the machine?
Hi, Sorry for the delay in getting back to you. I've just been trying out accessing directly in chrome, but I'm also seeing the slowness when prometheus is accessing it to, and the scrape duration time in Prometheus's targets page shows the long requests too.
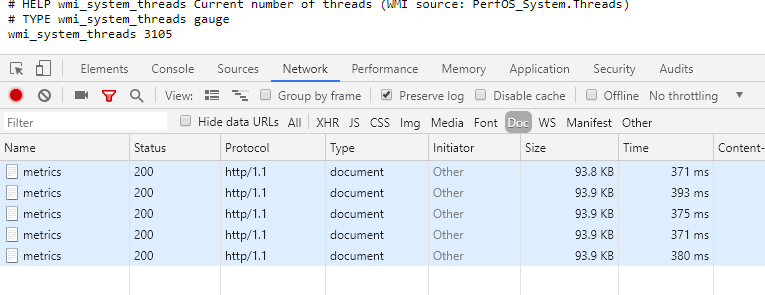
Accessing 0.6.0 in chrome for a few requests gave this:
And 0.7.999 gave this:
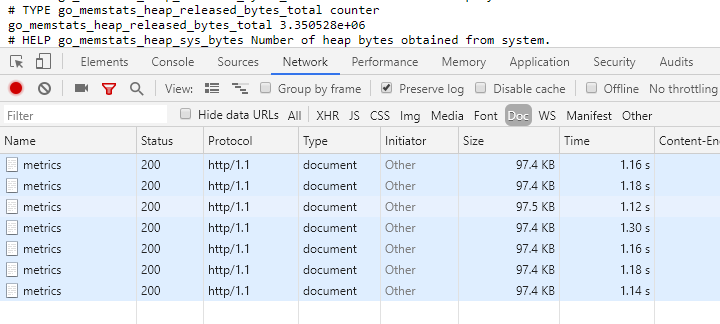
And that's both of them running exactly the same command line, load on the machine is negligible (it's just my dev machine at the moment)
I have also seen a few errors logged now, but it's not on every request, Output I'm getting in console is:
c:\application\monitoring\WmiExporter>wmi_exporter-0.7.999-preview.2-amd64.exe --collector.textfile.directory="C:\Application\Monitoring\WmiExporter" --telemetry.addr="127.0.0.1:9182" --telemetry.path="/wmi/metrics" --collectors.enabled="cpu,iis,logical_disk,cs,memory,net,os,process,system" --collector.process.processes-where="Name LIKE 'php-cgi%' OR Name LIKE 'w3wp%' OR Name Like 'mysqld' OR Name LIKE 'erl'"
[36mINFO[0m[0000] Enabled collectors: memory, process, iis, os, net, cs, logical_disk, system, cpu  [36msource[0m="exporter.go:313"
[36mINFO[0m[0000] Starting WMI exporter (version=0.7.999-preview.2, branch=timeout-scrapes, revision=daa6f3d111ba34a9eb64cdfbe5160192b4566e1a)  [36msource[0m="exporter.go:327"
[36mINFO[0m[0000] Build context (go=go1.12.3, user=appvyr-win\appveyor@APPVYR-WIN, date=20190525-12:49:02)  [36msource[0m="exporter.go:328"
[36mINFO[0m[0000] Starting server on 127.0.0.1:9182             [36msource[0m="exporter.go:331"
2019/06/12 10:02:10 http: panic serving 127.0.0.1:28240: runtime error: invalid memory address or nil pointer dereference
goroutine 27 [running]:
net/http.(*conn).serve.func1(0xc000072e60)
        C:/go/src/net/http/server.go:1769 +0x140
panic(0x918480, 0xdfaa50)
        C:/go/src/runtime/panic.go:522 +0x1c3
github.com/martinlindhe/wmi_exporter/vendor/github.com/prometheus/client_golang/prometheus.(*Registry).Gather(0xc000074600, 0x0, 0x0, 0x0, 0x0, 0x0)
        c:/gopath/src/github.com/martinlindhe/wmi_exporter/vendor/github.com/prometheus/client_golang/prometheus/registry.go:459 +0x516
github.com/martinlindhe/wmi_exporter/vendor/github.com/prometheus/client_golang/prometheus/promhttp.HandlerFor.func1(0xa788a0, 0xc00025c000, 0xc00010a100)
        c:/gopath/src/github.com/martinlindhe/wmi_exporter/vendor/github.com/prometheus/client_golang/prometheus/promhttp/http.go:82 +0x53
net/http.HandlerFunc.ServeHTTP(0xc000074a00, 0xa788a0, 0xc00025c000, 0xc00010a100)
        C:/go/src/net/http/server.go:1995 +0x4b
net/http.(*ServeMux).ServeHTTP(0xe08ae0, 0xa788a0, 0xc00025c000, 0xc00010a100)
        C:/go/src/net/http/server.go:2375 +0x1dd
net/http.serverHandler.ServeHTTP(0xc00006d1e0, 0xa788a0, 0xc00025c000, 0xc00010a100)
        C:/go/src/net/http/server.go:2774 +0xaf
net/http.(*conn).serve(0xc000072e60, 0xa79ca0, 0xc00002e3c0)
        C:/go/src/net/http/server.go:1878 +0x858
created by net/http.(*Server).Serve
        C:/go/src/net/http/server.go:2884 +0x2fb
2019/06/12 10:02:45 http: panic serving 127.0.0.1:28274: runtime error: invalid memory address or nil pointer dereference
goroutine 82 [running]:
net/http.(*conn).serve.func1(0xc000130000)
        C:/go/src/net/http/server.go:1769 +0x140
panic(0x918480, 0xdfaa50)
        C:/go/src/runtime/panic.go:522 +0x1c3
github.com/martinlindhe/wmi_exporter/vendor/github.com/prometheus/client_golang/prometheus.(*Registry).Gather(0xc000074600, 0x0, 0x0, 0x0, 0x0, 0x0)
        c:/gopath/src/github.com/martinlindhe/wmi_exporter/vendor/github.com/prometheus/client_golang/prometheus/registry.go:459 +0x516
github.com/martinlindhe/wmi_exporter/vendor/github.com/prometheus/client_golang/prometheus/promhttp.HandlerFor.func1(0xa788a0, 0xc0006bc0e0, 0xc00010a100)
        c:/gopath/src/github.com/martinlindhe/wmi_exporter/vendor/github.com/prometheus/client_golang/prometheus/promhttp/http.go:82 +0x53
net/http.HandlerFunc.ServeHTTP(0xc000074a00, 0xa788a0, 0xc0006bc0e0, 0xc00010a100)
        C:/go/src/net/http/server.go:1995 +0x4b
net/http.(*ServeMux).ServeHTTP(0xe08ae0, 0xa788a0, 0xc0006bc0e0, 0xc00010a100)
        C:/go/src/net/http/server.go:2375 +0x1dd
net/http.serverHandler.ServeHTTP(0xc00006d1e0, 0xa788a0, 0xc0006bc0e0, 0xc00010a100)
        C:/go/src/net/http/server.go:2774 +0xaf
net/http.(*conn).serve(0xc000130000, 0xa79ca0, 0xc000cdccc0)
        C:/go/src/net/http/server.go:1878 +0x858
created by net/http.(*Server).Serve
        C:/go/src/net/http/server.go:2884 +0x2fb
2019/06/12 10:02:46 http: panic serving 127.0.0.1:28317: runtime error: invalid memory address or nil pointer dereference
goroutine 196 [running]:
net/http.(*conn).serve.func1(0xc000130280)
        C:/go/src/net/http/server.go:1769 +0x140
panic(0x918480, 0xdfaa50)
        C:/go/src/runtime/panic.go:522 +0x1c3
github.com/martinlindhe/wmi_exporter/vendor/github.com/prometheus/client_golang/prometheus.(*Registry).Gather(0xc000074600, 0x0, 0x0, 0x0, 0x0, 0x0)
        c:/gopath/src/github.com/martinlindhe/wmi_exporter/vendor/github.com/prometheus/client_golang/prometheus/registry.go:459 +0x516
github.com/martinlindhe/wmi_exporter/vendor/github.com/prometheus/client_golang/prometheus/promhttp.HandlerFor.func1(0xa788a0, 0xc0006bc000, 0xc0003e4100)
        c:/gopath/src/github.com/martinlindhe/wmi_exporter/vendor/github.com/prometheus/client_golang/prometheus/promhttp/http.go:82 +0x53
net/http.HandlerFunc.ServeHTTP(0xc000074a00, 0xa788a0, 0xc0006bc000, 0xc0003e4100)
        C:/go/src/net/http/server.go:1995 +0x4b
net/http.(*ServeMux).ServeHTTP(0xe08ae0, 0xa788a0, 0xc0006bc000, 0xc0003e4100)
        C:/go/src/net/http/server.go:2375 +0x1dd
net/http.serverHandler.ServeHTTP(0xc00006d1e0, 0xa788a0, 0xc0006bc000, 0xc0003e4100)
        C:/go/src/net/http/server.go:2774 +0xaf
net/http.(*conn).serve(0xc000130280, 0xa79ca0, 0xc0002b0a40)
        C:/go/src/net/http/server.go:1878 +0x858
created by net/http.(*Server).Serve
        C:/go/src/net/http/server.go:2884 +0x2fb
Hey @petedishman, Thanks for the extra info! It took better part of the day, but I managed to track down the panic, at least (despite their name, race conditions aren't necessarily fast to debug...). I'll have another look at the performance now, see if I can reproduce it.
Ok, I think I have a decent explanation. First, why I didn't see it initially was due to just looking at the individual collector durations, which are more or less the same duration as v0.6. However, looking at the total duration (scrape_duration_seconds), I had a ~50% difference. Still not as large in absolute numbers as you see, just 200 vs 300 ms, but still it was consistently slower.
There's a simple explanation, though: It takes about 100 ms to fetch the perflib data. We already fetch all data from perflib, even though the preview version just uses the cpu bits (it's a fair amount of work to be selective, and not worth the complexity).
So, basically, we'll see the payoff from this as we remove more WMI calls, but for now we have to pay a small overhead to have that possibility.
Hi @carlpett Do you know if 0.7.999-preview.2 has been tested on older versions of Windows Server? Just today I missed few CPU usage alerts because we are not getting any metrics from the CPU collector although it is enabled. Below is example between two machines:
Windows Server 2008 R2 Enterprise, Version 6.1 (Build 7601: Service Pack 1) Standard install of wmi_exporter and then changed Registry setting ImagePath="C:\Program Files\wmi_exporter\wmi_exporter.exe" --log.format logger:eventlog?name=wmi_exporter --collectors.enabled cpu,cs,logical_disk,memory,net,os,system,service,textfile --collector.service.services-where "Name LIKE 'W3SVC%'" --scrape.max-duration 5s --telemetry.addr :9182
Results: wmi_exporter_build_info{branch="timeout-scrapes",goversion="go1.12.3",revision="daa6f3d111ba34a9eb64cdfbe5160192b4566e1a",version="0.7.999-preview.2"} 1
wmi_exporter_collector_duration_seconds{collector="cpu"} 0 wmi_exporter_collector_duration_seconds{collector="cs"} 0.1320075 wmi_exporter_collector_duration_seconds{collector="logical_disk"} 0.0380021 wmi_exporter_collector_duration_seconds{collector="memory"} 0.1500085 wmi_exporter_collector_duration_seconds{collector="net"} 0.1030059 wmi_exporter_collector_duration_seconds{collector="os"} 0.0740042 wmi_exporter_collector_duration_seconds{collector="service"} 0.3470198 wmi_exporter_collector_duration_seconds{collector="system"} 0.1180067 wmi_exporter_collector_duration_seconds{collector="textfile"} 0
wmi_exporter_collector_success{collector="cpu"} 0 wmi_exporter_collector_success{collector="cs"} 1 wmi_exporter_collector_success{collector="logical_disk"} 1 wmi_exporter_collector_success{collector="memory"} 1 wmi_exporter_collector_success{collector="net"} 1 wmi_exporter_collector_success{collector="os"} 1 wmi_exporter_collector_success{collector="service"} 1 wmi_exporter_collector_success{collector="system"} 1 wmi_exporter_collector_success{collector="textfile"} 1
wmi_exporter_collector_timeout{collector="cpu"} 0 wmi_exporter_collector_timeout{collector="cs"} 0 wmi_exporter_collector_timeout{collector="logical_disk"} 0 wmi_exporter_collector_timeout{collector="memory"} 0 wmi_exporter_collector_timeout{collector="net"} 0 wmi_exporter_collector_timeout{collector="os"} 0 wmi_exporter_collector_timeout{collector="system"} 0 wmi_exporter_collector_timeout{collector="textfile"} 0
Windows Server 2016, Version 1607 (OS Build 14393.2999) Standard install of wmi_exporter and then changed Registry setting ImagePath="C:\Program Files\wmi_exporter\wmi_exporter.exe" --log.format logger:eventlog?name=wmi_exporter --collectors.enabled cpu,cs,logical_disk,memory,net,os,system,service,textfile --collector.service.services-where "Name LIKE 'W3SVC%'" --scrape.max-duration 5s --telemetry.addr :9182
Results: wmi_exporter_build_info{branch="timeout-scrapes",goversion="go1.12.3",revision="daa6f3d111ba34a9eb64cdfbe5160192b4566e1a",version="0.7.999-preview.2"} 1
wmi_exporter_collector_duration_seconds{collector="cpu"} 0 wmi_exporter_collector_duration_seconds{collector="cs"} 0.0219852 wmi_exporter_collector_duration_seconds{collector="logical_disk"} 0.0909999 wmi_exporter_collector_duration_seconds{collector="memory"} 0.0480002 wmi_exporter_collector_duration_seconds{collector="net"} 0.6170003 wmi_exporter_collector_duration_seconds{collector="os"} 0.13 wmi_exporter_collector_duration_seconds{collector="service"} 0.6020047 wmi_exporter_collector_duration_seconds{collector="system"} 0.0690003 wmi_exporter_collector_duration_seconds{collector="textfile"} 0
wmi_exporter_collector_success{collector="cpu"} 1 wmi_exporter_collector_success{collector="cs"} 1 wmi_exporter_collector_success{collector="logical_disk"} 1 wmi_exporter_collector_success{collector="memory"} 1 wmi_exporter_collector_success{collector="net"} 1 wmi_exporter_collector_success{collector="os"} 1 wmi_exporter_collector_success{collector="service"} 1 wmi_exporter_collector_success{collector="system"} 1 wmi_exporter_collector_success{collector="textfile"} 1
wmi_exporter_collector_timeout{collector="cpu"} 0 wmi_exporter_collector_timeout{collector="cs"} 0 wmi_exporter_collector_timeout{collector="logical_disk"} 0 wmi_exporter_collector_timeout{collector="memory"} 0 wmi_exporter_collector_timeout{collector="os"} 0 wmi_exporter_collector_timeout{collector="service"} 0 wmi_exporter_collector_timeout{collector="system"} 0 wmi_exporter_collector_timeout{collector="textfile"} 0
Hi @zoransimeonov,
No, I haven't tested older versions. 2008R2 is right at the cutoff where we assume it support the more fine-grained ProcessorInformation data and switch to querying for that (For Win2008 and earlier we query for Processor instead), perhaps there are nuances there...
Could you check gwmi Win32_PerfRawData_Counters_ProcessorInformation in Powershell? (We actually don't query via WMI as of 0.7.999, but it's easier to check this way).
Do you get any error logs?
Error: collector cpu failed after 0.000000s: could not find counter "Clock Interrupts/sec" on instance. Running gwmi Win32_PerfRawData_Counters_ProcessorInformation does not list all counters needed. From the code I can see the cutoff is at 6.05 so we are using the wrong query for Windows Server 2008 R2 (Version 6.1). The support was extended until January 2020 so it won't be long before businesses are forced to upgrade...
I attached the text files from Win32_PerfRawData_Counters_ProcessorInformation and Win32_PerfRawData_PerfOS_Processor in case you need to compare the output.
Thanks Zoran
Win32_PerfRawData_Counters_ProcessorInformation.txt Win32_PerfRawData_PerfOS_Processor.txt
Ah. Seems you have the class, but not all the fields are available. I'll see what we can do about that.
@zoransimeonov I fixed this as good as can be by simply ignoring counters that aren't found. This means you'll still see them, but they'll be zeroed out. There's a debug-level log to troubleshoot if necessary.
I hope to cut a 0.8 release today with this.
The zeroing or rather the ignoring of missing counters is still present, having been introduced in 9308108.
The windows_exporter_collection_duration_seconds metrics reports that the default collector are taking ~0.01 seconds to collect, but I don't have a large enough sample size to confirm if the issue is no longer present.
This issue has been marked as stale because it has been open for 90 days with no activity. This thread will be automatically closed in 30 days if no further activity occurs.