helm-charts
 helm-charts copied to clipboard
prometheus-kube-stack: listening failed:10250 bind:address already in use & node-exporter didn't have free ports
Describe the bug a clear and concise description of what the bug is.
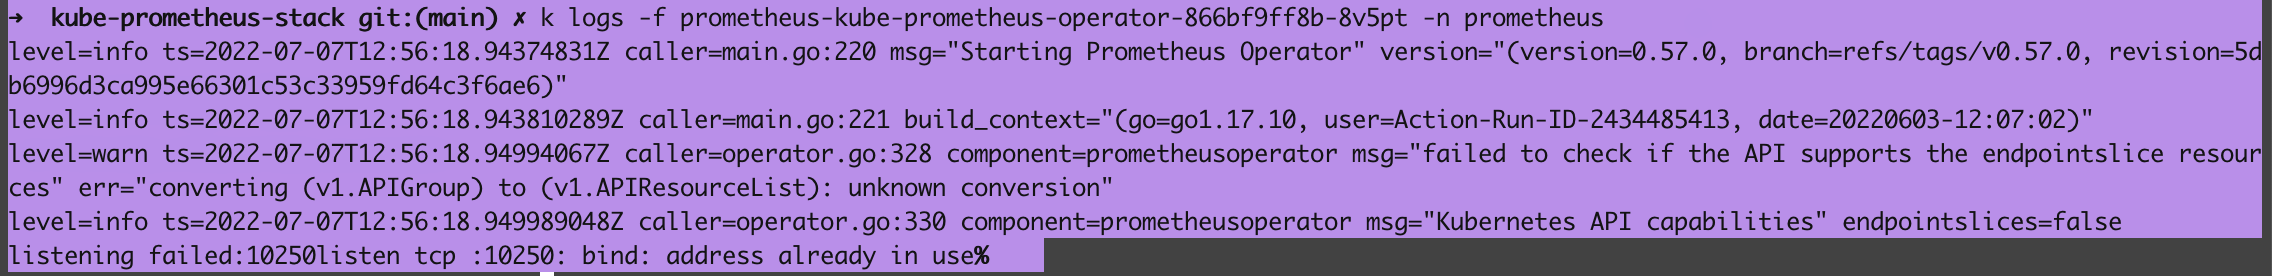
After performing the Helm Install of prometheus-kube-stack I get the error
level=info ts=2022-07-07T12:46:00.927428939Z caller=main.go:220 msg="Starting Prometheus Operator" version="(version=0.57.0, branch=refs/tags/v0.57.0, revision=5db6996d3ca995e66301c53c33959fd64c3f6ae6)" level=info ts=2022-07-07T12:46:00.92748578Z caller=main.go:221 build_context="(go=go1.17.10, user=Action-Run-ID-2434485413, date=20220603-12:07:02)" level=warn ts=2022-07-07T12:46:00.935651717Z caller=operator.go:328 component=prometheusoperator msg="failed to check if the API supports the endpointslice resources" err="converting (v1.APIGroup) to (v1.APIResourceList): unknown conversion" level=info ts=2022-07-07T12:46:00.935715772Z caller=operator.go:330 component=prometheusoperator msg="Kubernetes API capabilities" endpointslices=false listening failed:10250listen tcp :10250: bind: address already in use%
What's your helm version?
v3.8.0
What's your kubectl version?
v1.23.6
Which chart?
kube-prometheus-stack https://github.com/prometheus-community/helm-charts/tree/5cfd0de9b6a145299f93b93ce58d3ba5a3fb4212/charts/kube-prometheus-stack
What's the chart version?
0.47.0 ; https://github.com/prometheus-community/helm-charts/tree/5cfd0de9b6a145299f93b93ce58d3ba5a3fb4212/charts/kube-prometheus-stack
What happened?
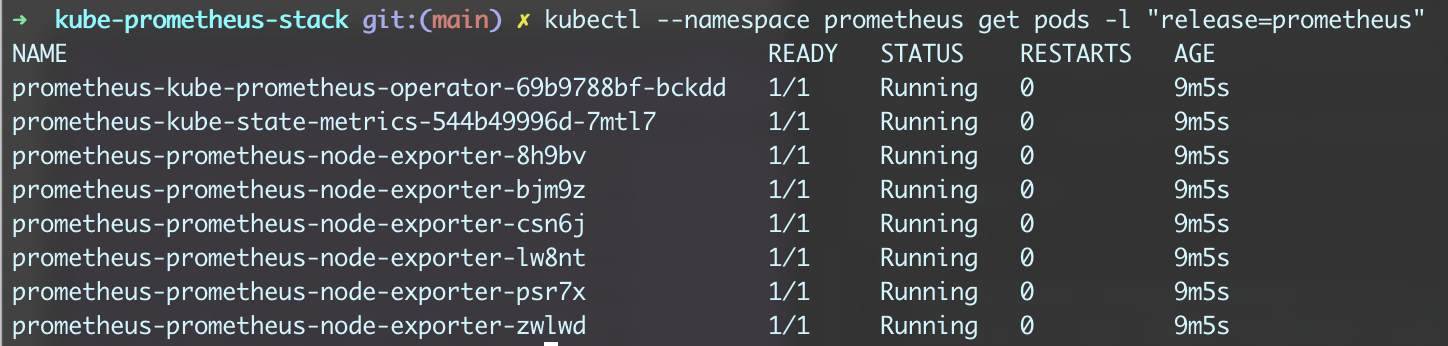
I followed the instruction to install Prometheus. After Installing when I execute
kubectl --namespace prometheus get pods -l "release=prometheus"

What you expected to happen?
Prometheus should be accessible. I have Configured Kubespray, MetalLB as LoadBalancer & Nginx ingress controller. Which work with my sample pod deployment
How to reproduce it?
I have to install all the CRD explicitly beforehand. (Otherwise I was getting this issue https://stackoverflow.com/questions/72133926/deploy-kube-prometheus-stack-with-kustomize-dont-work/72382972?noredirect=1#comment128750788_72382972)
helm install -f values.yaml prometheus prometheus-community/kube-prometheus-stack -n prometheus with hostNetwork: true
Enter the changed values of values.yaml?
hostNetwork: true ingress.enabled: true admissionWebhooks.enabled: false
Enter the command that you execute and failing/misfunctioning.
helm install -f values.yaml prometheus prometheus-community/kube-prometheus-stack -n prometheus
Anything else we need to know?
I am using MetalLB Kubespray Ingress Nginx
In your setup you are reusing IP addresses and different services want to use the port 10250, probably because of hostNetwork: true. Since https://github.com/prometheus-community/helm-charts/pull/400 it is possible to change the webhook port. Try setting to a different value:
prometheusOperator.tls.internalPort
In your setup you are reusing IP addresses and different services want to use the port 10250, probably because of
hostNetwork: true. Since #400 it is possible to change the webhook port. Try setting to a different value:prometheusOperator.tls.internalPort
Thank you. I changed the internalPort:10260. The prometheus operator got started. All of the node exporter are not getting started Warning FailedScheduling 4m15s (x159 over 179m) default-scheduler 0/6 nodes are available: 1 node(s) didn't have free ports for the requested pod ports, 5 node(s) didn't match Pod's node affinity/selector.
I suggest you to stop using host ports (hostNetwork: true) if you do not want to solve such issues yourself.
Hi, I override the values.yaml https://github.com/prometheus-community/helm-charts/blob/main/charts/kube-prometheus-stack/values.yaml#L1459 file as below with new port number. with hostNetwork: true
so another node_exporter is on 19100 the old node_exporter is still alive on 9100 (how to get rid of this)

prometheus-node-exporter:
  namespaceOverride: ""
  podLabels:
    ## Add the 'node-exporter' label to be used by serviceMonitor to match standard common usage in rules and grafana dashboards
    ##
    jobLabel: node-exporter
  extraArgs:
    - --collector.filesystem.mount-points-exclude=^/(dev|proc|sys|var/lib/docker/.+|var/lib/kubelet/.+)($|/)
    - --collector.filesystem.fs-types-exclude=^(autofs|binfmt_misc|bpf|cgroup2?|configfs|debugfs|devpts|devtmpfs|fusectl|hugetlbfs|iso9660|mqueue|nsfs|overlay|proc|procfs|pstore|rpc_pipefs|securityfs|selinuxfs|squashfs|sysfs|tracefs)$
  service:
    type: ClusterIP
    port: 19100
    targetPort: 19100
    nodePort:
    portName: metrics
    listenOnAllInterfaces: true
    annotations:
      prometheus.io/scrape: "true"
This issue has been automatically marked as stale because it has not had recent activity. It will be closed if no further activity occurs. Any further update will cause the issue/pull request to no longer be considered stale. Thank you for your contributions.