Client.Timeout exceeded while awaiting headers What is wrong?
level=warn ts=2019-09-05T06:13:55.737048219Z caller=indices.go:1025 msg="failed to fetch and decode index stats" err="failed to get index stats from http://10.11.110.25:9200/_all/_stats: Get http://10.11.110.25:9200/_all/_stats?level=shards: net/http: request canceled (Client.Timeout exceeded while awaiting headers)"
most probably a not reachable ES URL (wrong address or a not answering cluster)
I also had this situation.But only occasionally for a few minutes.Does anyone know why?Does this happen when port access is frequent?
I can't tell and it's probably very setup specific. I can add a http.Client instrumentation, so the exporter exports metrics about the http client (timing, request rate). Would that help?
but a simple reliably occuring Client.Timeout exceeded error points more to a misconfigured ES URL
but a simple reliably occuring Client.Timeout exceeded error points more to a misconfigured ES URL
Hello, I would like to ask if this exporter can start after specifying multiple client nodes. There are three clients in our cluster. Currently, exporter only accesses one of them, and there is no load balancing.
Hello, I would like to ask if this exporter can start after specifying multiple client nodes. There are three clients in our cluster. Currently, exporter only accesses one of them, and there is no load balancing.
no, this is not supported and not the recommended way to monitor a ES cluster. See https://github.com/justwatchcom/elasticsearch_exporter/issues/117 for more details
Hello, I would like to ask if this exporter can start after specifying multiple client nodes. There are three clients in our cluster. Currently, exporter only accesses one of them, and there is no load balancing.
no, this is not supported and not the recommended way to monitor a ES cluster. See #117 for more details
Thank you. It seems that I need to build an additional client for exporter only.
Same issue here with elasticsearch installed on kubernetes via helm. It may be an issue related to Elasticsearch.
It occurs occasionally. Here are logs from elasticsearch-exporter.
level=info ts=2020-06-30T09:19:04.035503294Z caller=clusterinfo.go:169 msg="providing consumers with updated cluster info label"
level=info ts=2020-06-30T09:24:04.035541431Z caller=clusterinfo.go:169 msg="providing consumers with updated cluster info label"
level=warn ts=2020-06-30T09:26:55.548181097Z caller=nodes.go:1851 msg="failed to fetch and decode node stats" err="failed to get cluster health from http://elasticsearch-master.logcenter.svc.cluster.local:9200/_nodes/stats: Get http://elasticsearch-master.logcenter.svc.cluster.local:9200/_nodes/stats: net/http: request canceled (Client.Timeout exceeded while awaiting headers)"
level=warn ts=2020-06-30T09:27:32.493793274Z caller=nodes.go:1851 msg="failed to fetch and decode node stats" err="failed to get cluster health from http://elasticsearch-master.logcenter.svc.cluster.local:9200/_nodes/stats: Get http://elasticsearch-master.logcenter.svc.cluster.local:9200/_nodes/stats: net/http: request canceled (Client.Timeout exceeded while awaiting headers)"
level=warn ts=2020-06-30T09:28:32.501934597Z caller=nodes.go:1851 msg="failed to fetch and decode node stats" err="failed to get cluster health from http://elasticsearch-master.logcenter.svc.cluster.local:9200/_nodes/stats: Get http://elasticsearch-master.logcenter.svc.cluster.local:9200/_nodes/stats: net/http: request canceled (Client.Timeout exceeded while awaiting headers)"
level=info ts=2020-06-30T09:29:04.035502968Z caller=clusterinfo.go:169 msg="providing consumers with updated cluster info label"
level=warn ts=2020-06-30T09:29:32.502414301Z caller=nodes.go:1851 msg="failed to fetch and decode node stats" err="failed to get cluster health from http://elasticsearch-master.logcenter.svc.cluster.local:9200/_nodes/stats: Get http://elasticsearch-master.logcenter.svc.cluster.local:9200/_nodes/stats: net/http: request canceled (Client.Timeout exceeded while awaiting headers)"
level=warn ts=2020-06-30T09:32:06.964469888Z caller=nodes.go:1851 msg="failed to fetch and decode node stats" err="failed to get cluster health from http://elasticsearch-master.logcenter.svc.cluster.local:9200/_nodes/stats: Get http://elasticsearch-master.logcenter.svc.cluster.local:9200/_nodes/stats: net/http: request canceled (Client.Timeout exceeded while awaiting headers)"
level=warn ts=2020-06-30T09:34:01.315255254Z caller=indices.go:1061 msg="failed to fetch and decode index stats" err="failed to get index stats from http://elasticsearch-master.logcenter.svc.cluster.local:9200/_all/_stats: Get http://elasticsearch-master.logcenter.svc.cluster.local:9200/_all/_stats: net/http: request canceled (Client.Timeout exceeded while awaiting headers)"
level=info ts=2020-06-30T09:34:04.035541557Z caller=clusterinfo.go:169 msg="providing consumers with updated cluster info label"
level=info ts=2020-06-30T09:39:04.035539174Z caller=clusterinfo.go:169 msg="providing consumers with updated cluster info label"
level=warn ts=2020-06-30T09:40:06.970788652Z caller=nodes.go:1851 msg="failed to fetch and decode node stats" err="failed to get cluster health from http://elasticsearch-master.logcenter.svc.cluster.local:9200/_nodes/stats: Get http://elasticsearch-master.logcenter.svc.cluster.local:9200/_nodes/stats: net/http: request canceled (Client.Timeout exceeded while awaiting headers)"
level=warn ts=2020-06-30T09:41:32.503115882Z caller=nodes.go:1851 msg="failed to fetch and decode node stats" err="failed to get cluster health from http://elasticsearch-master.logcenter.svc.cluster.local:9200/_nodes/stats: Get http://elasticsearch-master.logcenter.svc.cluster.local:9200/_nodes/stats: net/http: request canceled (Client.Timeout exceeded while awaiting headers)"
level=warn ts=2020-06-30T09:43:20.617710587Z caller=nodes.go:1851 msg="failed to fetch and decode node stats" err="failed to get cluster health from http://elasticsearch-master.logcenter.svc.cluster.local:9200/_nodes/stats: Get http://elasticsearch-master.logcenter.svc.cluster.local:9200/_nodes/stats: net/http: request canceled (Client.Timeout exceeded while awaiting headers)"
level=info ts=2020-06-30T09:44:04.035495899Z caller=clusterinfo.go:169 msg="providing consumers with updated cluster info label"
level=warn ts=2020-06-30T09:44:32.495983341Z caller=nodes.go:1851 msg="failed to fetch and decode node stats" err="failed to get cluster health from http://elasticsearch-master.logcenter.svc.cluster.local:9200/_nodes/stats: Get http://elasticsearch-master.logcenter.svc.cluster.local:9200/_nodes/stats: net/http: request canceled (Client.Timeout exceeded while awaiting headers)"
level=warn ts=2020-06-30T09:45:32.499921498Z caller=nodes.go:1851 msg="failed to fetch and decode node stats" err="failed to get cluster health from http://elasticsearch-master.logcenter.svc.cluster.local:9200/_nodes/stats: Get http://elasticsearch-master.logcenter.svc.cluster.local:9200/_nodes/stats: net/http: request canceled (Client.Timeout exceeded while awaiting headers)"
level=warn ts=2020-06-30T09:45:45.931563041Z caller=indices.go:1061 msg="failed to fetch and decode index stats" err="failed to get index stats from http://elasticsearch-master.logcenter.svc.cluster.local:9200/_all/_stats: Get http://elasticsearch-master.logcenter.svc.cluster.local:9200/_all/_stats: net/http: request canceled (Client.Timeout exceeded while awaiting headers)"
level=warn ts=2020-06-30T09:46:01.306751281Z caller=indices.go:1061 msg="failed to fetch and decode index stats" err="failed to get index stats from http://elasticsearch-master.logcenter.svc.cluster.local:9200/_all/_stats: Get http://elasticsearch-master.logcenter.svc.cluster.local:9200/_all/_stats: net/http: request canceled (Client.Timeout exceeded while awaiting headers)"
level=info ts=2020-06-30T09:49:04.035511697Z caller=clusterinfo.go:169 msg="providing consumers with updated cluster info label"
level=info ts=2020-06-30T09:54:04.035533077Z caller=clusterinfo.go:169 msg="providing consumers with updated cluster info label"
level=info ts=2020-06-30T09:59:04.03552392Z caller=clusterinfo.go:169 msg="providing consumers with updated cluster info label"
Here is a snapshot of prometheus monitoring.
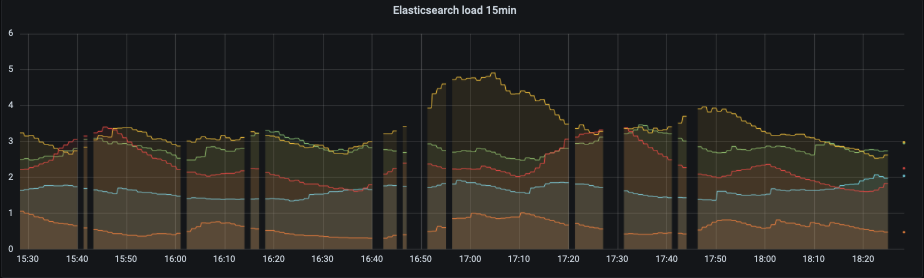 When there is a log line saying
 Client.Timeout exceeded while awaiting headers, there is a break in the monitoring graph.
Everything such as load average, cpu/mem usage looks good at that time. Maybe the load average is a little bit higher, but it is far from overload.
My cluster have four nodes, one master node and three data nodes, running separately on four different physical machines (32 cores Intel(R) Xeon(R) CPU E5-2630 v3 @ 2.40GHz and 128 GiB memory each) monopolized.
Part of master node values.yml
esJavaOpts: "-Xmx6g -Xms6g"

resources:
  limits:
    cpu: "6"
    memory: "16Gi"
Part of data node values.yml
esJavaOpts: "-Xmx28g -Xms28g"

resources:
  limits:
    cpu: "28"
    memory: "96Gi"
Hi @danksim This is another account of @blueabysm. Finally I found that it's because I was using GlusterFS as the persistent storage on Kubernetes. For some reasons, GlusterFS didn't distribute data balance enough, so some of my storage nodes were in heavy load. Rebalancing worked to me.
I'm having this same issue on a gke cluster and I am not using gluster. If I exec into the exporter pod and curl the same url, it returns data fine. Is there a way to increase the timeout on the fetch?
for me, increasing the timeout worked, the default timeout of 5s may not suffice for some clusters
Default timeout of 5 seconds was causing a headache for us, we have 11 instances of elastic and they're all in the same datacentre, however apparently 5 seconds was too little. What's odd is the cluster has plenty of spare resources, and no indication of pressure. Bumping timeout to 10 seconds resolved our Client.Timeout issue.