Gradual Increase in CPU and memory usage by `calico-node -felix` due to increasing number of eBPF programs
Hi! We've been using calico for a while now and love it, but recently we've been having an issue where the CPU usage and memory consumption of the calico-node pods seems to climb over time due to a buildup of loaded eBPF programs which eventually causes instability on our cluster.
Expected Behavior
The CPU and memory usage of the calico node should remain around the same during the lifetime of the pod.
Current Behavior
The CPU and memory usage increases over time as shown in this image (for our 13 nodes both metrics gradually increase until we begin to see 502s from high CPU usage and container creation errors related to hitting the bpf_jit_limit.
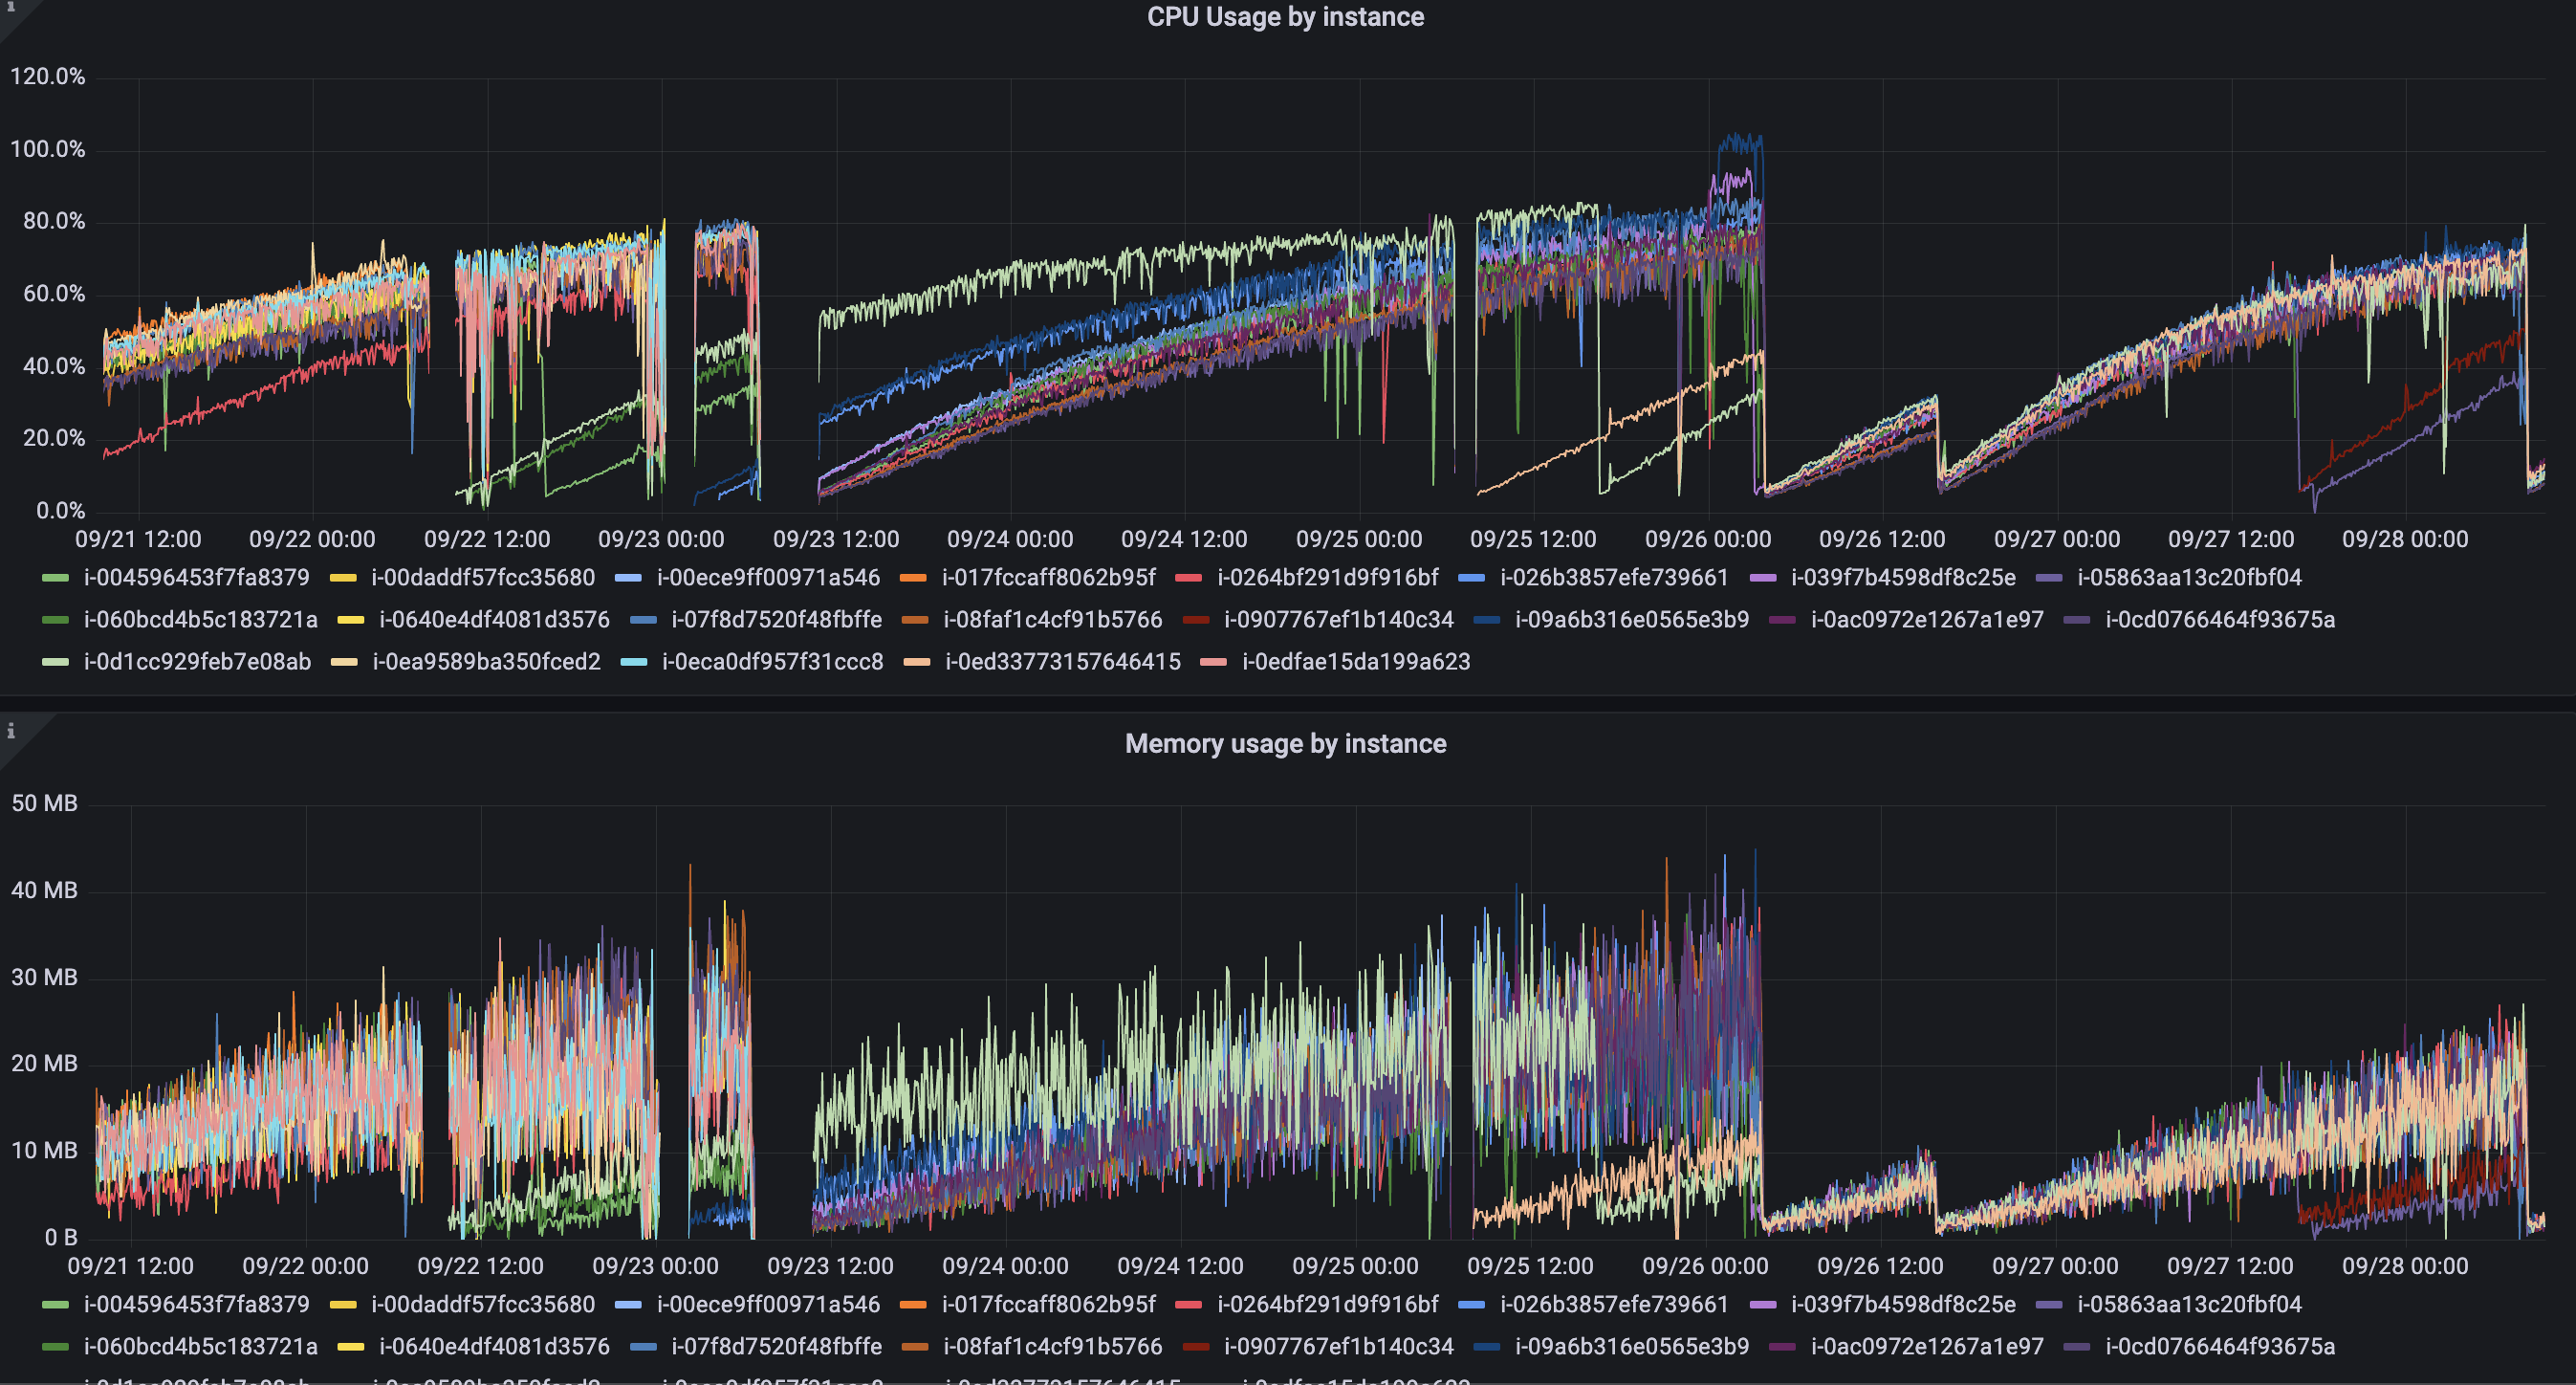
As seen in the graph, it takes around two days for the resource consumption to climb high enough to cause disruption, at which point we manually kill the pods which seems "reset" it.
Possible Solution
After some investigation it seems that the issue to something to do with eBPF programs not being cleaned up hence the number of loaded programs increases. On nodes that have an older calico instance on them, the number of loaded programs is very high. For example on a node who's calico pod has been around for a while:
% bpftool prog list | grep btf_id | wc -l
37769
Versus a node with a newer instance:
% bpftool prog list | grep btf_id | wc -l
485
On older nodes this command takes many seconds to execute. We noticed while looking at htop that this command is used by calico for cleaning up unused maps, so calling this command and parsing the large JSON output is slowing calico down. Looking around in that code we saw that there is logging for the failure to clean up programs but after checking through the logs we couldn't find any messages matching "failed to clean up one or more old calico programs".
We can currently get around this issue by periodically restarting the calico-node pods, however this isn't ideal and it would be great to know if there is actually an issue or if there's something wrong in our set up.
Steps to Reproduce (for bugs)
Context
Your Environment
Calico version v3.23.3
Kubernetes cluster with version v1.24.4 running on AWS with 13 nodes (3 master 10 worker)
We are using IPnIP encapsulation with the eBPF datapane.
Our nodes are running ubuntu with kernel version 5.15.0-1019-aws
If anyone has seen this kind of thing before and knows if we're doing something wrong or if its a code issue any help would be greatly appreciated!
Thank you :)
Seems like a code issue. If you have a reasonably steady number of pods, you should have a steady number of programs. If the number of programs keep increasing, then there is a leak. Thanks for reporting it. We will have a look at this. We also want to dramatically reduce the number of programs since loading so many programs takes time.
@harryc0oper can you share the list of BPF programs (bpftool prog list) and also the list of interfaces (ip link) for both nodes?
@harryc0oper I have not been able to reproduce this issue. To help finding the issue and fixing it, can you please share the following output from one of the nodes showing the symptoms?
bpftool prog list
bpftool net
ip link
These should give me enough data to pin point the issue.
Hey! Apologies for not responding before, unfortunately I can't get those outputs since we have already reverted back to non-eBPF mode on the cluster due to the disruption which was blocking development. I can see if I can re-enable it briefly to collect the data you need.
Thanks
Thanks @harryc0oper . Looking forward to get the information from your cluster.
Couldn't reproduce this on calico v3.23 even after aggressively churning pods for 2 hours. @harryc0oper please update the issue with the information from your cluster whenever you could.
The result was the same for a cluster with master hash release. The cluster was stressed for 6 hours.
Closing due to inactivity, but feel free to re-open if have more information.