vectorbt
 vectorbt copied to clipboard
Handling missing price data?
How do you handle missing price data? Let's say you are operating on an international portfolio. Business days are not aligned. As a result, you have nan values in your dataframe.
I am wondering how to handle these circumstances? One approach would be to fill the holes with the previous value (ffill). That would make the computation of daily returns correct (in the sense that the return dataframe doesn't have any nan values). However, if you do that and then compute an indicator, let's say a simple moving average, the computation would be incorret. You must compute an indicator on the individual column while ignoring the respective nan values.
I am curious how you approach a situation like this?
You don't need to do much, vectorbt already does many things under the hood. At least vectorbt's own indicators know how to handle nan values. Then, during the simulation, vectorbt automatically uses the latest known price for computing target percentages and stuff. Finally, after the simulation, whenever you call pf.value() or any other attribute, Portfolio automatically forward and backward fills missing values.
import vectorbt as vbt

vbt.Portfolio.from_orders([1, np.nan, 2], size=1).value()
0    100.0
1    100.0
2    101.0
dtype: float64
@polakowo I have a more concrete example at hand with respect to a relative momentum system. I kept it as simple as possible. Here are the steps to compute a trading signal.
On the last day of the month
- compute the 3M absolute momentum (=rate of change =percentage change) for every security in the portfolio
- create a ranking
- invest 100% in the best performing asset
What seems to be very simple, might not be as simple when dealing with international trading calendars.
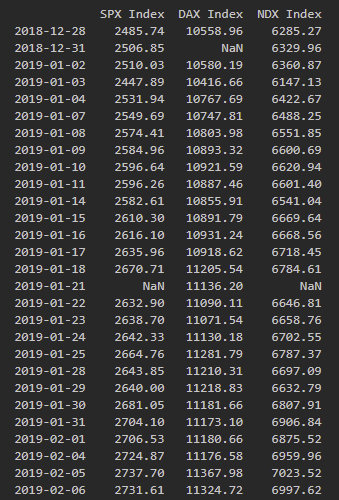
Here you can see a two asset portfolio with DAX and S&P 500 closing prices (left-hand side). The German DAX didn't trade on 1999-12-31, while S&P did. You can find the computation of the 3M absolute momentum on the right-hand side.
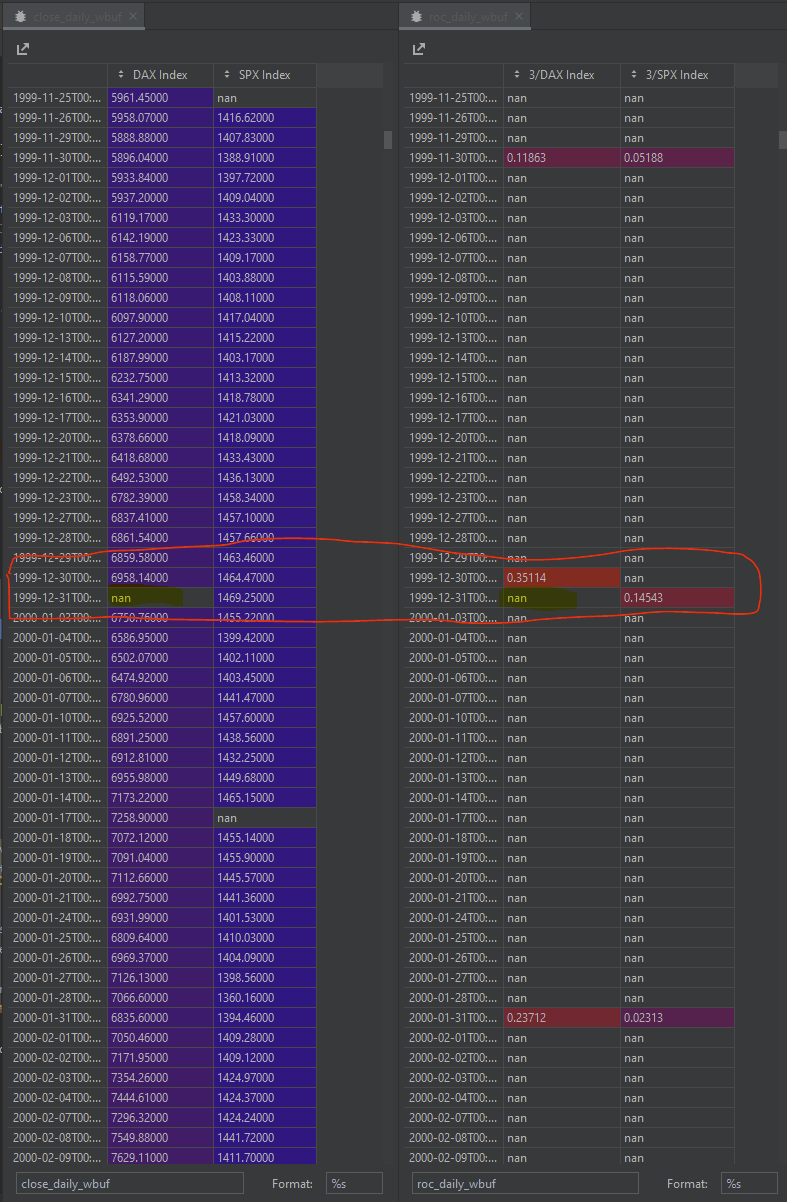
Now, in reality, I would wait until after 1999-12-31 US closing, compute the 3M abs. momentum for DAX and SPX, compare it to each other and invest in the better performing asset (DAX in this case). I would then issue a buy order which would be executed at the open price of the following bar (2000-01-03).
Here's my question, finally ;-) How would you compute the signals given the fact that the indicator values, which you have to compare to each other, are not necessarily in the same row?. Also, let's say, I would make the indicator values available on the very last day of the month for every security, there might not be a closing value for this particular date, which could be used by the system to compute entry/exit values etc.
@andreas-vester forward filling is the only plausible solution in this case, which is not critical in most cases since each filled nan value represents the latest known value in reality. In your example, you can leave the prices as they are, and forward fill indicator values. You then select the point in time where decision to buy or not should take place (1999-12-31), keep its value and set all preceding points of this month to nan, and then shift the entire array forward by one (df.vbt.fshift) to execute the order on the next day (non-na value moves to 2000-01-03).
In cases like this you shouldn't pick the vectorized approach, as simple as that. I'm not a big fan of building large matrices and processing them back and forth. The best approach, in my opinion, is to implement as much logic as possible in an event-driven manner, that is, one timestamp by one, either using IndicatorFactory or Portfolio.from_order_func.