[BUG] build_ranged providing unexpected results.
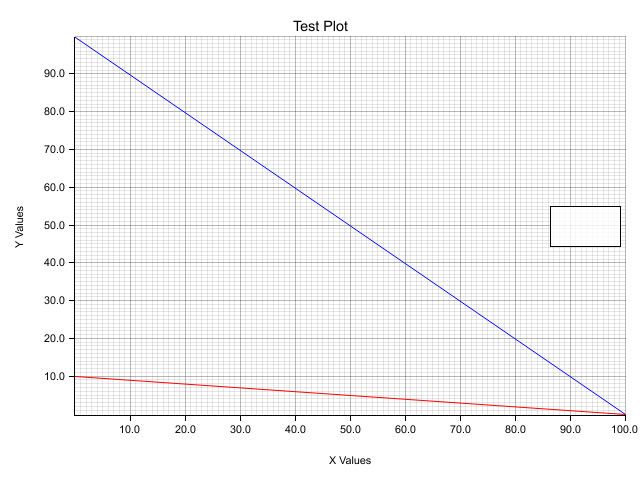
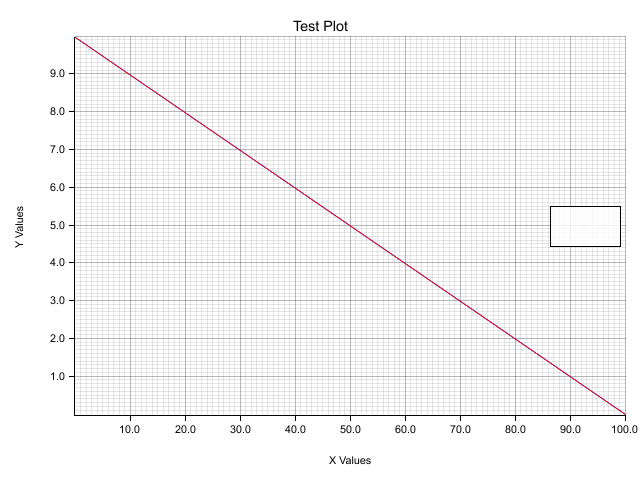
The selection of the range in the build_ranged method seems to be changing the values I'm plotting. The next two plots use identical data but simply use different ranges for the chart. Both plot two lines, one from (0,100) to (100,0) in blue, and one from (0,10) to (0,100) in red.
The first chart uses a y-axis 0-100, and the second 0-10. For some reason the plot lines in the second chart align exactly, even though they are using completely different values. This only occurs when setting a range smaller than the given data, not when setting one larger than the data. For example a y-axis of 0-200 works as expected.
Here is the code for production of the charts above:
use plotters::prelude::*;

fn main() -> Result<(), Box<dyn std::error::Error>> {
    let root = BitMapBackend::new("plot.png", (640, 480)).into_drawing_area();
    root.fill(&WHITE)?;
    let mut chart = ChartBuilder::on(&root)
        .caption("Test Plot", ("Arial", 16).into_font())
        .margin(15)
        .x_label_area_size(50)
        .y_label_area_size(60)
        .build_ranged(0_f32..100.0_f32, 0_f32..200.0_f32)?;

    chart
        .configure_mesh()
        .x_desc("X Values")
        .y_desc("Y Values")
        .draw()?;

    let data_points: Vec<(f32, f32)> = vec![(0.0_f32, 100.0_f32), (100.0_f32, 0.0_f32)];
    chart.draw_series(LineSeries::new(data_points.into_iter(), &BLUE))?;

    let data_points2: Vec<(f32, f32)> = vec![(0.0_f32, 10.0_f32), (100.0_f32, 0.0_f32)];
    chart.draw_series(LineSeries::new(data_points2.into_iter(), &RED))?;

    chart
        .configure_series_labels()
        .background_style(&WHITE.mix(0.8))
        .border_style(&BLACK)
        .margin(20)
        .draw()?;
    Ok(())
}
This occurs both with the current version on crates.io as well as git master.
This plot may be informative too:
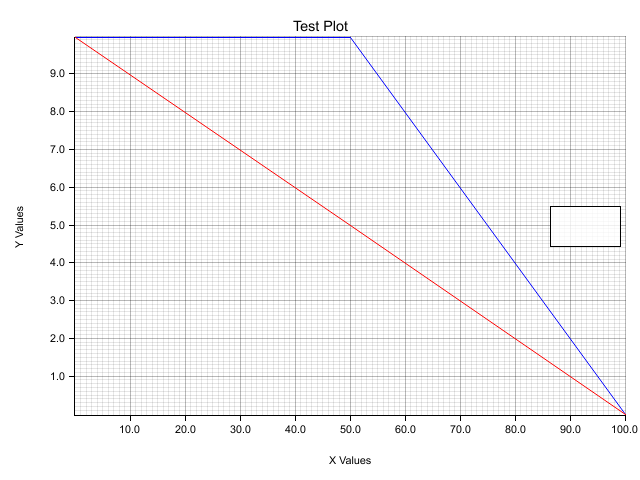
The plot uses the following data:
let data_points: Vec<(f32, f32)> = vec![(0.0_f32, 100.0_f32), (50.0_f32, 50.0_f32), (100.0_f32, 0.0_f32)];
chart.draw_series(LineSeries::new(data_points.into_iter(), &BLUE))?;

let data_points2: Vec<(f32, f32)> = vec![(0.0_f32, 10.0_f32), (50.0_f32, 5.0_f32), (100.0_f32, 0.0_f32)];
chart.draw_series(LineSeries::new(data_points2.into_iter(), &RED))?;
Here there are three points for each line. This indicates that all of the points with y-coordinates that lie outside the range are having their coordinates clamped to the limits of the range.
The issue seems to be the call to truncate here:
/// Draw an high-level element
pub fn draw<'a, E>(&self, element: &'a E) -> Result<(), DrawingAreaError<DB>>
where
    &'a E: PointCollection<'a, CT::From>,
    E: Drawable<DB>,
{
    let backend_coords = element.point_iter().into_iter().map(|p| {
        let b = p.borrow();
        self.rect.truncate(self.coord.translate(b))
    });
    self.backend_ops(move |b| element.draw(backend_coords, b, self.dim_in_pixel()))
}
which clamps the coordinate the element is drawn at to the drawing area. Removing the truncate fixes the wrong behaviour, but instead draws points and lines outside of the actual plotting area, into the label margins (and possibly all kinds of other unwanted behaviour where DrawingArea's are used).
I guess what should happen instead is that elements outside of the area either don't get drawn at all, or (better) some kind of transparency mask is applied to them to cut them off at the edge of the drawing area. I'm not sure how doable that is across backends, though.
Alternatively, have the ChartContext filter out points and modify lines so they end at the borders of the drawing area. Line caps wouldn't be neat, but that's a much smaller problem than the clamping happening now.
Yep, this behavior is pretty much from the beginning of this project. And this is one of the worst dirty hack still exists in this crate.
One of the reason for not removing this silently is some of the element assume exact number of vertices, which means drop the out of range vertices may not be the right thing to do. I believe having a mask API would be the best way to handle this case in my opinion, but this requires some amount of work.
But actually I think it's more practical fix is handling the out of range data points in the data series. Actually this is why I use truncate at that point, since I once thought the data series is always responsible for validating the data inputs.
Thus, I think the potential would be having a line cap algorithm in LineSeries type https://github.com/38/plotters/blob/b8d115dcf8d0f269de3ebdb56a32b68b5d192895/src/series/line_series.rs#L18. Thoughts?
For my own app I've now implementing a filtering step that removes points entirely for data sent to a PointSeries and for LineSeries splits the data into several lines when it crosses the range bounds, which end exactly at the edge of the range. This was more complicated that I anticipated, and involves an allocation each time a line crosses the range edge.
Making the series types handle this kind of filtering themselves would work, but of course they'd have to know about the ranges (which could probably be taken care of by the ChartContext before the iterator is used). The LineSeries could then just create one PathElement for each visible part of the line as it's iterated over, truncating the paths correctly as it generates them.
Conceptually, however, it feels wrong that the series types have to filter their data to avoid the drawing area messing with it. I feel like it should be the DrawingArea's job to correctly deal with things being drawn (fully or partially) outside of its bounds.
So the most natural (and probably most performant) solution would be to not worry about filtering the data, but to apply a mask for the actual plotting area via the DrawingArea and have the backend sort it out. Unfortunately, this is also the solution involving the most work, as you mentioned.
That's more or less the same conclusion I came to. There are two ways to approach it:
- Modify the data series or elements to fit the chart.
- Apply clipping in the backend.
I'm a big advocate for the second option, if for nothing else it means implementing it per-backend rather than per-element-type, which reduces the burden on creating new types of chart. Also @Irockasingranite mentioned, modifying the data means calculating intersections and inserting new points. This can get complicated and involve a huger number of edge cases. More importantly, it's different for every element type. There is also the risk of getting misleading results if we modify the data.
For example, if we modified the data:
- With simple unconnected point data, we would want to truncate points outside the range. This would be fine.
- For line series we would want to add new data points at the intersection of the line and the chart boundary, and also split the line series into chunks so that we don't connect the disparate sections.
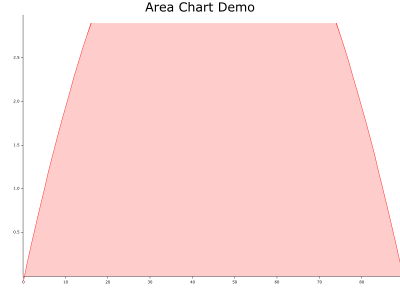
- For area series we would need to do the same thing line that edges the area, but not the area itself. I don't think area does any clipping at the moment.
We don't want the dark red line in the image below.
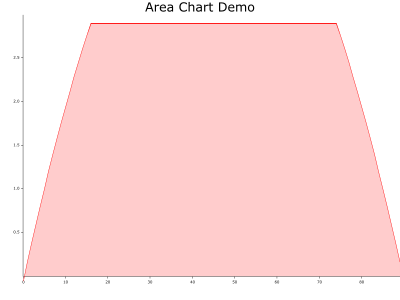
We want it to look like this. This means the line has different clipping logic from the shading.
This is a whole lot of clipping logic that could get more and more complex, particularly if we want it to look good. One of the advantages I see in plotters is that you can create fairly aribitrary charts (e.g. the mandelbrot set in the examples). We lose a bit of this flexibility if we have to design new clipping algorithms for each type.
It also allows us to take advantage of the characteristics of each backend. For example, we might want to take advantage of SVG's clipping ability (or not).
I do believe clipping the chart area as it is drawn to be the cleaner abstraction for sure. At first I thought it might be more work to implement, but after considering the implications for different chart types, I'm nearly certain that isn't the case.
The only disdvantage of this solution is that if you were to draw millions of points outside the chart area it might be more efficient to filter the data first, but I don't think this is unreasonable. Users would expect that the rendering cost increases as the number of elements increases, and they always have the option to filter the data themselves first if they have a particularly pathological case.
In my hacky workaround I just commented out that code and use SVG clipping manually.
My biggest concern about having a transparent mask is performance of BitMapBackend, since there's a lot of buffer manipulation code for performance purpose. (And we are actually several times faster than using the image crate to manipulate a bitmap) We need to figure out how to avoid most of the performance penalty - I mean although the performance isn't always a concern, but this is really a big deal when we have an app runs on a mobile device, such as a raspberry pi.
Actually I agree with you guys. I believe this truncate behavior is one of the worst hack in Plotters today. I definitely wants to get rid of it and I like the drawing area clamps the out-of-range pixels. In fact I am working on a 0.3 major release now, which means if we have this done, we can get all these changes could ship with 0.3 release. And I think we are in a good window now.
Combines all those thoughts, I would like to suggest a compromise solution, that introduces an optional clamping flag. If anyone who cares the performance can turn clamping off (And I actually want to leave clamping on by default). And what they could do is 1. fix the data before sending to plotters and 2. turn off clamping.
Really appreciate those thoughts, and please let me know if you guys have any thoughts.
Thank you guys so much!
I hadn't even considered that every shape would need its own workaround. In light of that, I definitely agree with @JakeOShannessy that having the area do the clipping is actually less effort in the long run.
If performance for the bitmap backend is a concern, I would leave the fast clamping behaviour as an opt-in mode for when performance matters, but I would use the proper clipping by default. It's the expected behaviour and shouldn't be much of a performance issue with most backends if the mask is applied correctly (i.e. once for the whole area, not one for each element).
I agree, and would go as far as to say that the act of clipping (especially rectilinearly) is very cheap. There will be bounds checks on the memory buffer when doing bitmap manipulation, so the clipping itself would be free if implemented well. The only exception would be if you had a large number of complex shapes outside the chart area, in which case it would be cheaper not to rasterise them at all. But we could event implement some primitive data filtering by not rasterizing and elements (e.g. line segments) that clearly fall outside the chart area (the pixel level clipping would deal with overlapping elements).
@38 thanks for looking into it. I'm interested that you prefer the clamping behaviour. What's the benefit? It truly hadn't considered that there might be a use case for it, so I'm curious as to how you're taking advantage of it. It seems like it's an ability that needs to be maintained.
Also, just to clarify, I don't think we need to use any transparent masks (where we need to do colour blending etc.) just straight up clipping (in this case a couple of integer comparisons).
I might need to implement something in the short-term for some projects just sticking with simple clipping, so we might event be able to compare some different techniques with benchmarks and pros/cons.
Opps, I am sorry. I think I have just made some confusing use of clipping vs clamping.
To clarify, my idea on this issue is:
- (a) If performance isn't a problem, dropping all pixels that out of area is ideal behavior (I agree with both of you guys)
- (b) If performance is a concern, even a integer comparison may cause an observable perf regression - Making series do not emit out-of-range elements would be the cheapest choice
But I don't think we are going to alter behavior of elements - And in approach (b) it's the series iterator rather than element take care of the issue. And I believe someone may intentionally draw some elements out of the drawing area and approach (b) makes this possible. This is impossible for now.
So I am suggesting to have both (a) and (b) as solution. And (a) would be default as long as quality is the more important than performance in most use cases. But for use cases power consumption is critical, they should be able to turns to use (b) method.
So my understand is I am agree with @JakeOShannessy on the clipping behavior and @Irockasingranite about the opt in and out ability for clipping. - Correct me if I was wrong.
Also I agree with @JakeOShannessy , alpha channels are too expensive in term of performance. Clipping is good enough, but we also needs to be very careful about the performance impact as I mentioned even a comparison may be very expensive.
If @JakeOShannessy can do some simply clipping benchmark that would be pretty awesome!