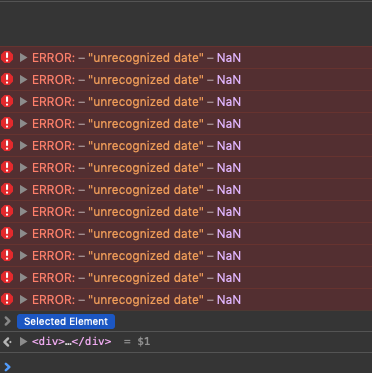
Dates are not correctly recognized
My dates on x-axis
['2019-05-11T00:00:00.000000000' '2019-05-22T00:00:00.000000000'
 '2019-05-23T00:00:00.000000000' '2019-05-24T00:00:00.000000000'
 '2019-05-25T00:00:00.000000000' '2019-05-27T00:00:00.000000000'
 '2019-05-28T00:00:00.000000000' '2019-05-29T00:00:00.000000000'
 '2019-05-30T00:00:00.000000000' '2019-05-31T00:00:00.000000000'
 '2019-06-01T00:00:00.000000000' '2019-05-21T00:00:00.000000000'
 '2019-05-13T00:00:00.000000000']
Dash / Jupyter won't plot it. However, if it's offline mode, I can see the visualization correctly from rendered html file.
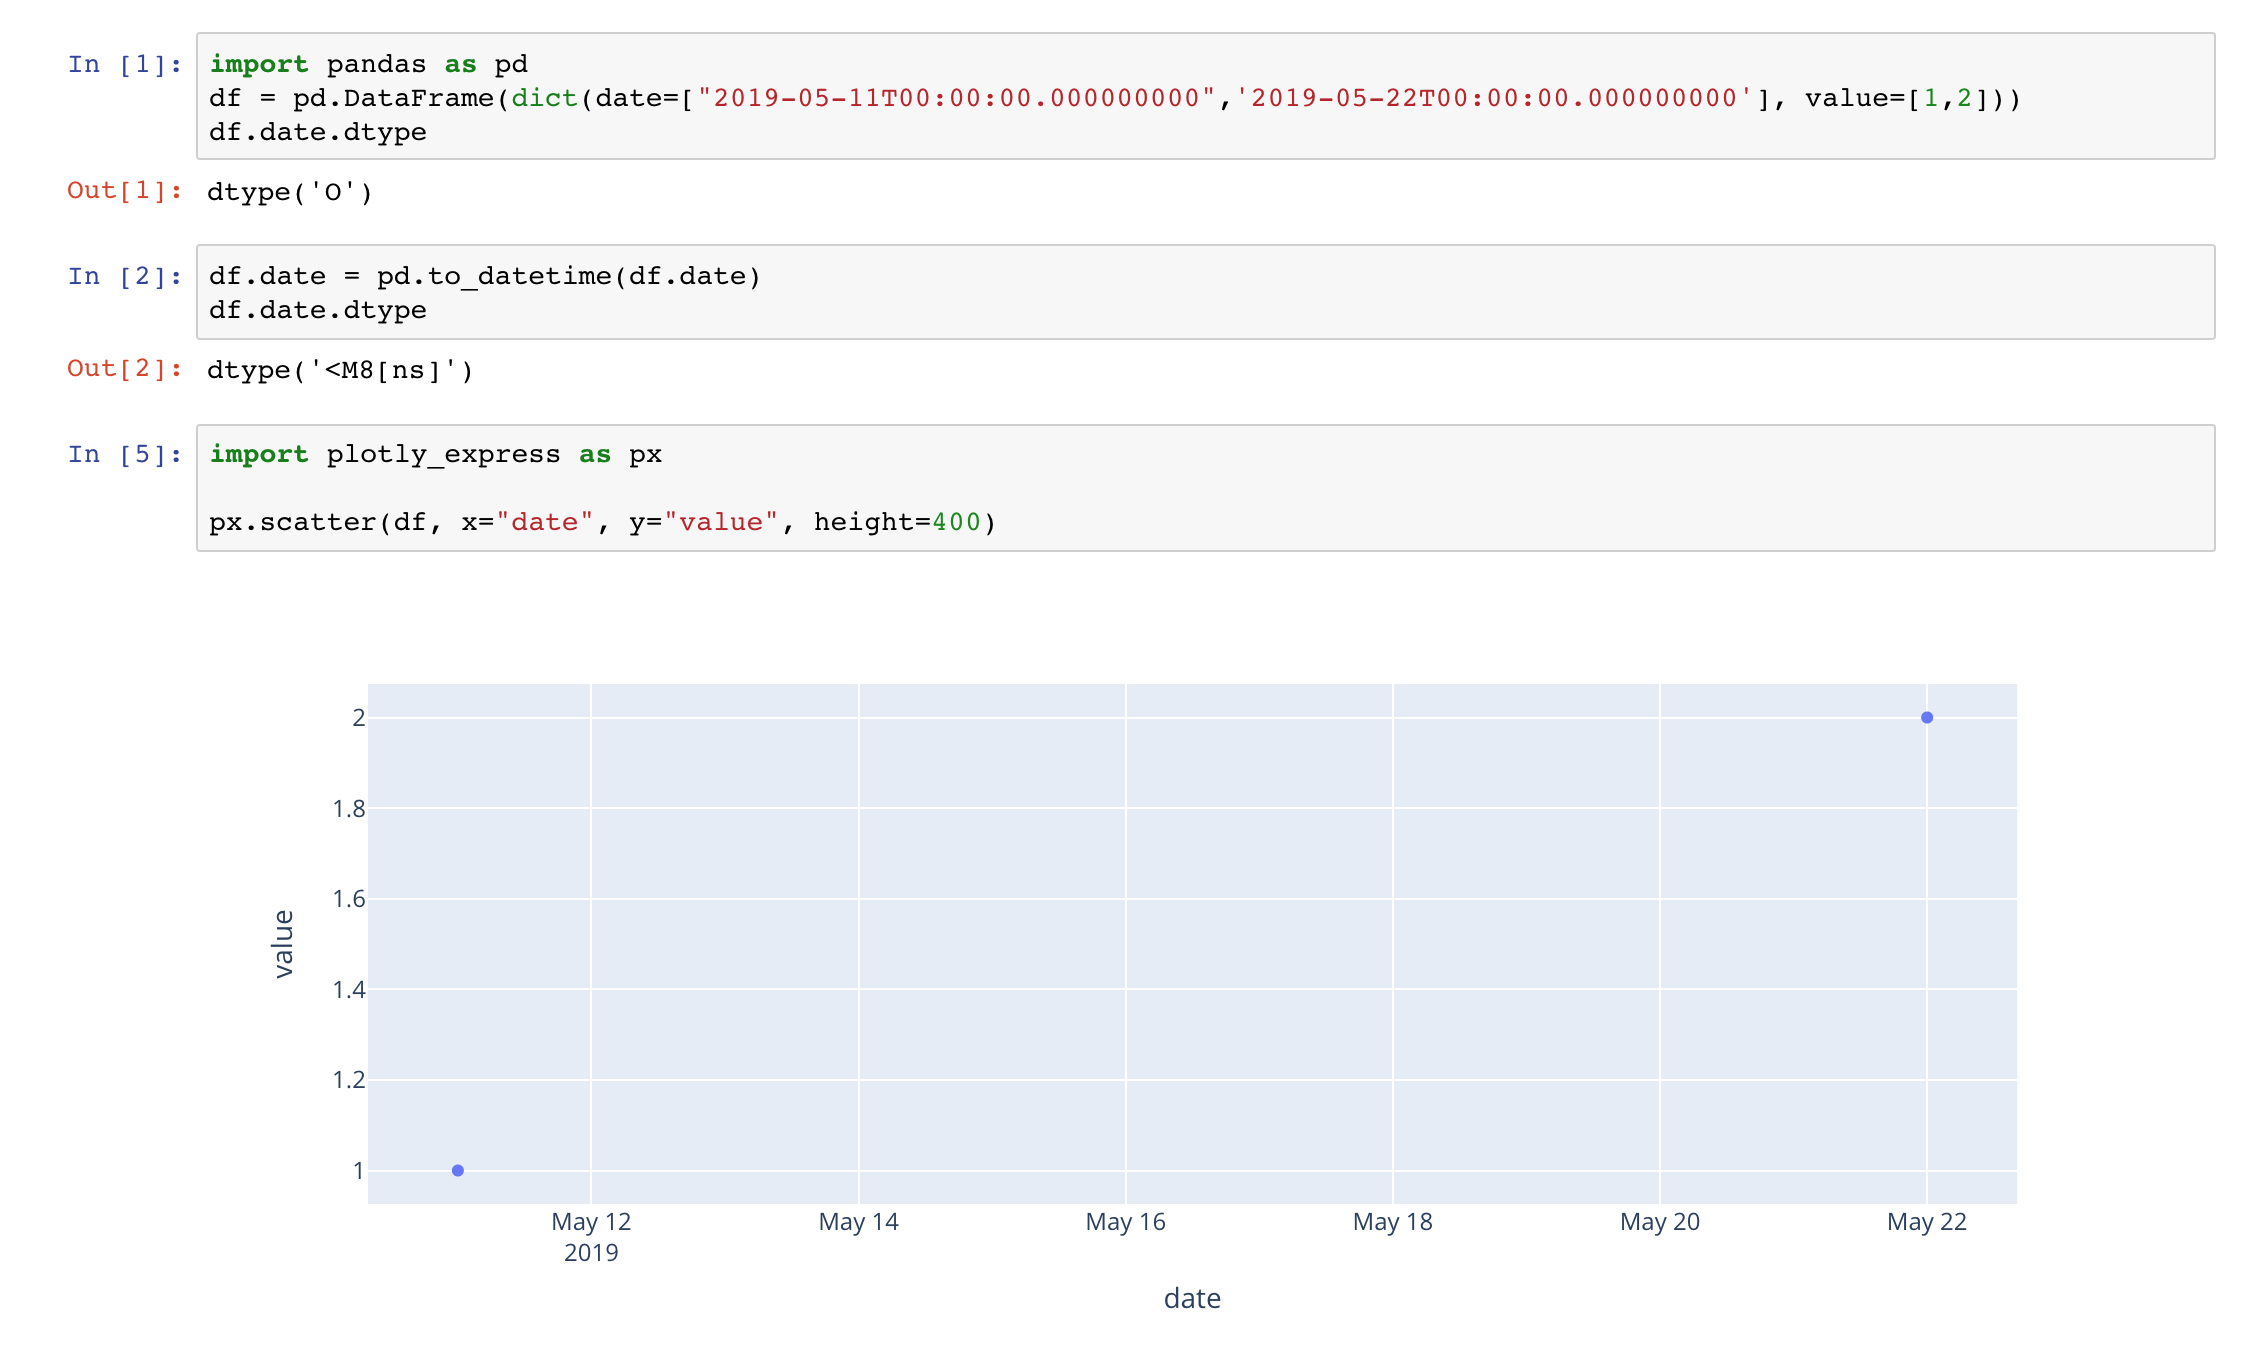
If you convert the data frame column to a date column, this should work automatically.
OK, can you please share a minimum example of this issue? Also please let me know which versions of Python and Pandas you're running.
This works for me using Python 3.7 and Pandas 0.23.0:
They don't work as index though:
df = pd.DataFrame({
    "a": [1, 2, 3, 4],
    "i": pd.date_range(start=dt.datetime(2019, 1, 1, 0), periods=4, freq="D")
})

px.line(df, x="i", y="a")  # Works

px.line(df.set_index("i"), x=df["i"], y="a")  # Doesn't work
px.line(df.set_index("i"), x=df.set_index("i").index, y="a")  # Doesn't work

df_i = df.set_index("i")
px.line(df_i, x=df_i.index, y="a")  # Doesn't work
px.line(df.set_index("i"), x=df["i"], y="a") # Doesn't work
This is normal because df.set_index("i") results in a new dataframe, without mutating df.
px.line(df.set_index("i"), x=df.set_index("i").index, y="a") # Doesn't work
This in principle should work although it's really odd because you're making two copies of df
px.line(df_i, x=df_i.index, y="a") # Doesn't work
This is probably the recommended way, and should work.
This does work:
px.line(df_i, x=df_i.index, y=df.a)
@emmanuelle can you take a look at some of the cases above here and LMK if you agree about the "should work" cases and take a look at why they might not be working please?
@Juanlu001 thanks for the interesting and easy to reproduce bug report ;)