plotly.py
 plotly.py copied to clipboard
Published
20 hours ago •
 plotly
BUG: rangebreaks for datetime axises, the value+dvalue doesn't work with bounds
It looks that the value+dvalue mode doesn't work well with the bounds mode for rangebreak parameter of the datetime axis. Below is an simple example to replicate the issue:
packages import and data preparation:
import numpy as np
import pandas as pd
from pandas.tseries.offsets import CustomBusinessHour, BusinessDay
from pandas.tseries.holiday import USFederalHolidayCalendar
import plotly.offline as py
import plotly.graph_objs as go

x = pd.bdate_range('2020-12-15', '2021-01-15', freq=CustomBusinessHour(calendar=USFederalHolidayCalendar()))
y = np.sin(np.arange(len(x))/3)
Scenario I, bounds only to exclude non-business hours and weekends
layout1=go.Layout(xaxis=dict(tickangle=45, rangebreaks=[
    dict(pattern='hour', bounds=[17, 9]),
    dict(bounds=['sat', 'mon'])
]))
fig1 = go.Figure(data=go.Scatter(x=x, y=y), layout=layout1)
fig1.show()
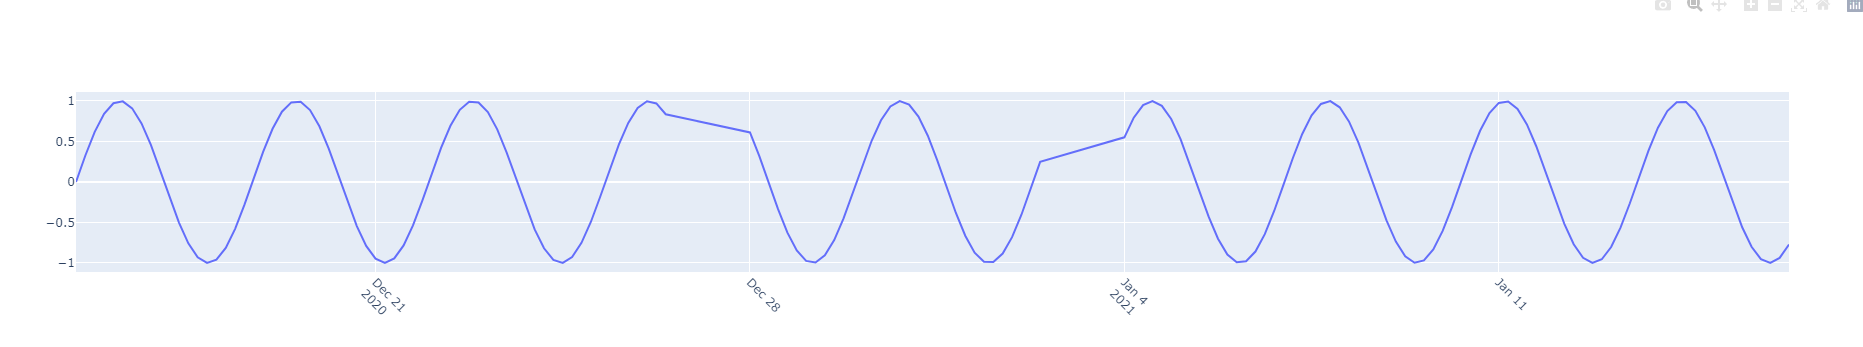 We see the discontinuity on business-day holidays 2020-12-25, 2021-01-01 as expected.
Scenario II, trying to exclude the holidays with values dict
missing_date2 = list(set(pd.bdate_range('2020-12-15', '2021-01-15')) - set(x.normalize()))

layout2=go.Layout(xaxis=dict(tickangle=45, rangebreaks=[
    dict(values=missing_date2),
    dict(pattern='hour', bounds=[17, 9]),
    dict(bounds=['sat', 'mon']),
]))
fig2 = go.Figure(data=go.Scatter(x=x, y=y), layout=layout2)
fig2.show()
 We see the plot get messed.
Scenario III, use values for day level only:
Even I don't use bounds for weekends, it still faces same problem:
missing_date3 = list(set(pd.date_range('2020-12-15', '2021-01-15')) - set(x.normalize()))

layout3=go.Layout(xaxis=dict(tickangle=45, rangebreaks=[
    dict(values=missing_date3),
    dict(pattern='hour', bounds=[17, 9]),
]))
fig3 = go.Figure(data=go.Scatter(x=x, y=y), layout=layout3)
fig3.show()

Can someone help take a look please?