plotly.js
 plotly.js copied to clipboard
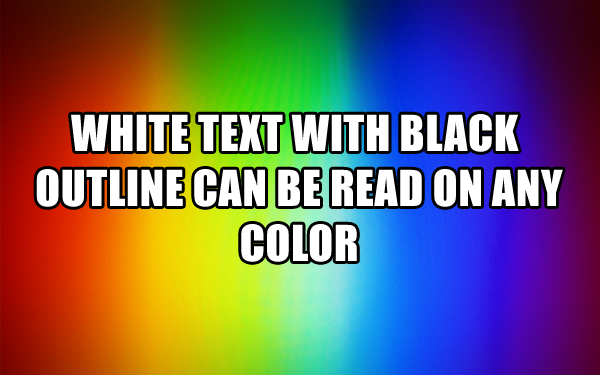
Outline for text layers
It would be very helpful to be able to add outlines to text layers. This allows for text to be legible on any background (eg white text with black outline, or black text with white outline).
Also, though not strictly related, there does not seem to be any documentation of the options "familysrc", "sizesrc", or "colorsrc" anywhere. https://plot.ly/javascript/reference/#bar-textfont https://plot.ly/r/reference/#scatter-textfont
Related: https://github.com/talgalili/heatmaply/issues/42
Also, though not strictly related, there does not seem to be any documentation of the options "familysrc", "sizesrc", or "colorsrc" anywhere.
Those shouldn't even be displayed in the docs pages. Thanks for pointing this out.
No worries, fyi there are a few similar things hanging around in the documentation, eg https://plot.ly/javascript/reference/#bar-marker-colorbar-tickvalssrc
It would be very helpful to be able to add outlines to text layers.
About this here, can you share a screenshot to help us understand what you're looking for?
Google maps uses dark text with a white outline, while white text with a dark outline also works. It's the most effective way to make text readable on any background

A note on implementation: for SVG, it requires two copies of the text element with different stroke-width properties (that is, it's possible but not just a simple property, which means it requires a bit more effort)
Our much-neglected polar charts do this with the text-shadow style:

<text dy="0" y="0" x="0" dx="0" transform="rotate(45) translate(0,15)" style="
  text-anchor: start;
  font-size: 15px;
  font-family: Tahoma, sans-serif;
  fill: gray;
  text-shadow: white -1px 0px 0px, white 1px -1px 0px, white -1px 1px 0px, white 1px 1px 0px;
">0</text>
Might cease to look good at a greater thickness though, as that's not going to increase the radius of curvature. But it at least avoids having to copy everything. Kind of an odd collection of offsets, I wonder if that was intentional...
I'll also note that applying this to mathjax will require a completely distinct implementation regardless, as it generates its own SVG paths.
From https://github.com/plotly/plotly.js/pull/3191#issuecomment-434676329
Definitely an improvement! I'm just wondering if we want to go one step further and make a new attribute (
tickshadow?) that defaults topaper_bgcolorbut people could set it to whatever they want (including transparent).
@etpinard : After reading through this issue it is not clear to me what the solution is.
Imagine the following case: on top of a choropleth map you add a text trace to indicate a value permanently (not just through a hover). Considering that the heatmap has colors from light yellow to dark blue, it is almost impossible to choose a font color of the text trace which is visible on the map. What would you suggest?