plotly.R

plotly.R copied to clipboard
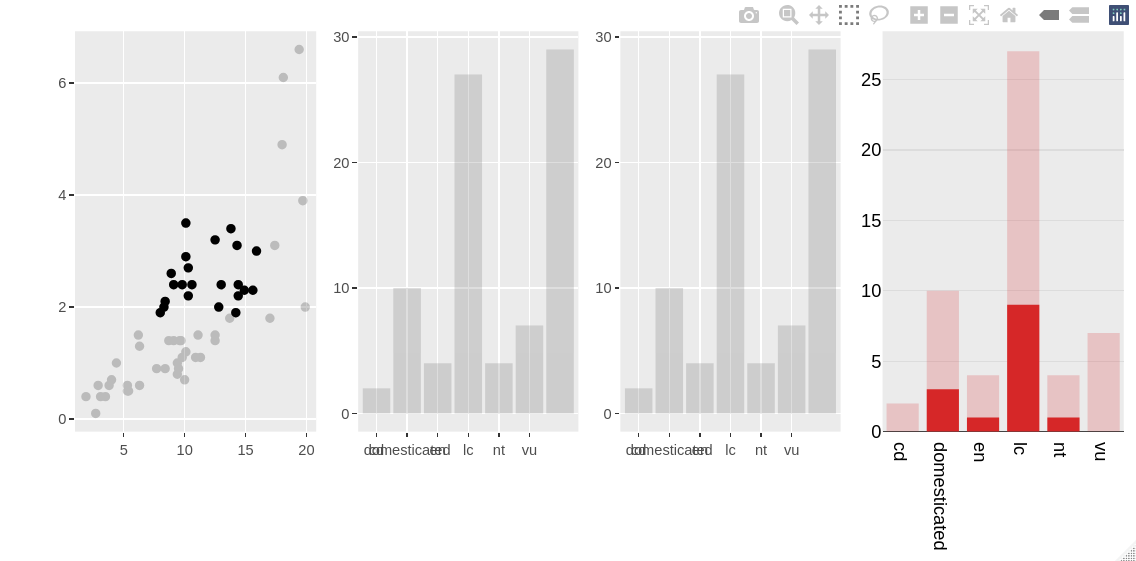
partial bar highlight does not work on `geom_bar()` or `geom_hist()` converted with `ggplotly()`
A highlighted plotly "histogram" can have its bars partially highlighted (with best results achieved with the "overlay" barmode), but an equivalent ggplot2 object converted with ggplotly() can't.
This reproducible example showcases all three options. One can drag a rectangle around some points to see that only the pure plotly visualisation gets bar overlays. A bar will only be completely highlighted if all the cases for that bar are selected in the scatterplot.
library(ggplot2)
library(plotly)
# set up highlightable dataset
msleep_h <- highlight_key(msleep)
# scatterplot
gg_point <- (ggplot(msleep_h, aes(x = sleep_total, y = sleep_rem)) +
  geom_point()) %>%
  ggplotly()
# ggplot2 bar chart does a count
gg_bar <- (ggplot(msleep_h, aes(x = conservation)) +
  geom_bar()) %>%
  ggplotly() %>%
  layout(barmode = "overlay")
# also try a histogram geom, which requires switching to the count stat
gg_hist <- (ggplot(msleep_h, aes(x = conservation)) +
             geom_histogram(stat = "count")) %>%
  ggplotly() %>%
  layout(barmode = "overlay")
# plotly equivalent
plt_hist <- plot_ly(msleep_h) %>%
  add_histogram(x = ~conservation) %>%
  layout(barmode = "overlay")
# side by side
subplot(gg_point, gg_bar, gg_hist, plt_hist) %>%
  highlight("plotly_selected")