dash-table
 dash-table copied to clipboard
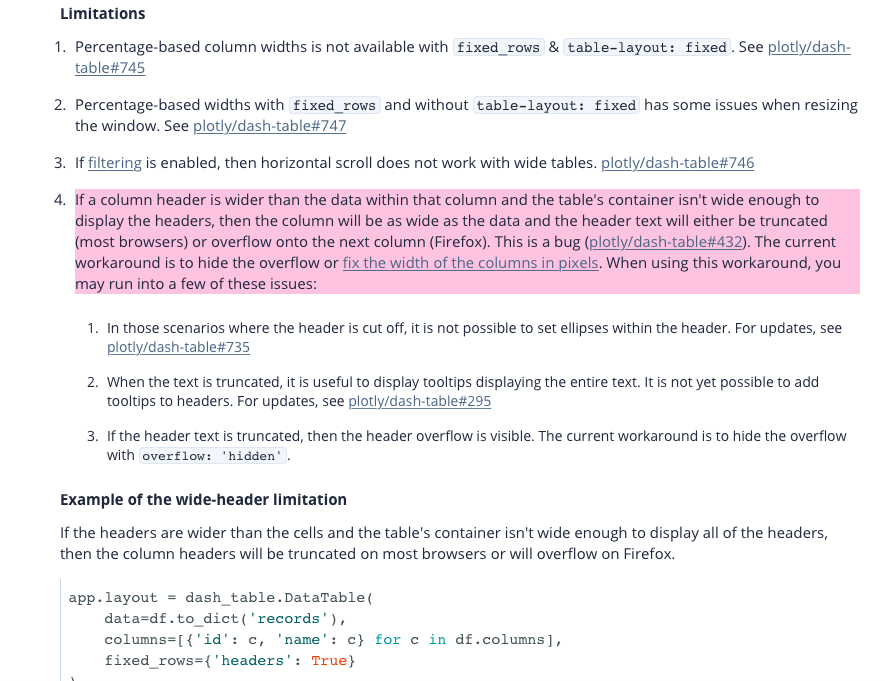
With fixed rows, columns are as wide as the data and not the headers
In this example, "Date received" is cut-off as "2015-02-01" is shorter than that column name. But in the complaints column, the column width is as wide as the cell's content.

import dash
from dash.dependencies import Input, Output
import dash_html_components as html
import dash_design_kit as ddk
from dash_table import DataTable

import json
import pandas as pd

types = {
    'id': 'numeric',
    'ZIP code': 'text',
    'Date received': 'datetime',
    'Date sent to company': 'datetime',
}

df = pd.read_csv('1k-consumer-complaints.csv')
df['id'] = df['Unnamed: 0']
df = df.drop(['Unnamed: 0'], axis=1)
df = df.reindex(columns=['id']+df.columns[:-1].tolist())

app = dash.Dash(__name__)
app.scripts.config.serve_locally = True

app.layout = ddk.App([
    DataTable(
        id='demo-table',
        data=df.to_dict('rows'),
        columns=[{ 'id': i, 'name': i, 'type': types.get(i, 'any') } for i in df.columns],
        filtering='be',
        pagination_mode=False,
        virtualization=True,
        n_fixed_rows=2,
        style_cell={
            'min-width': '100px'
        },
        css=[
            { 'selector': '.row-1', 'rule': 'min-height: 500px;' }
        ]
    ),
    html.Pre(id='filter-input')
])


def to_string(filter):
    l_type = filter.get('type')
    l_sub = filter.get('subType')

    if l_type == 'relational-operator':
        if l_sub == '=':
            return '=='
        else:
            return l_sub
    else:
        return filter.get('value')


def handle_leaf(filter, df_filter):
        return (to_string(filter), df_filter)


def handle_default(filter, df_filter):
    left = filter.get('left', None)
    right = filter.get('right', None)

    (left_query, left_df) = to_panda_filter(left, df_filter)
    (right_query, right_df) = to_panda_filter(right, left_df)

    return ('{} {} {}'.format(
        left_query,
        to_string(filter) if left_query != '' and right_query != '' else '',
        right_query
    ).strip(), right_df)


def handle_contains(filter, df_filter):
    left = filter.get('left', None)
    right = filter.get('right', None)

    (left_query, left_df) = to_panda_filter(left, df_filter)
    (right_query, right_df) = to_panda_filter(right, left_df)

    return ('', right_df[right_df[left_query].astype(str).str.contains(right_query)])


def handle_datestartswith(filter, df_filter):
    left = filter.get('left', None)
    right = filter.get('right', None)

    (left_query, left_df) = to_panda_filter(left, df_filter)
    (right_query, right_df) = to_panda_filter(right, left_df)

    return ('', right_df[right_df[left_query].astype(str).str.startswith(right_query)])


def to_panda_filter(filter, df_filter):
    if filter is None:
        return ('', df_filter)

    l_type = filter.get('type')
    l_sub = filter.get('subType')

    left = filter.get('left', None)
    right = filter.get('right', None)

    if left is None and right is None:
        return handle_leaf(filter, df_filter)
    elif l_type == 'relational-operator' and l_sub == 'contains':
        return handle_contains(filter, df_filter)
    elif l_type == 'relational-operator' and l_sub == 'datestartswith':
        return handle_datestartswith(filter, df_filter)
    else:
        return handle_default(filter, df_filter)


@app.callback(
    [Output("demo-table", "data"),
     Output("filter-input", "children")],

    [Input("demo-table", "derived_filter_structure")]
)
def onFilterUpdate(filter):
    (pandas_query, df_filter) = to_panda_filter(filter, df)
    return [
        df_filter.query(pandas_query).to_dict('rows') if pandas_query != '' else df_filter.to_dict('rows'),
        json.dumps(filter, indent=4)
    ]


if __name__ == "__main__":
    app.run_server(debug=True)
Note: Remove limitation from https://dash.plotly.com/datatable/height (https://github.com/plotly/dash-docs/pull/847/files) once fixed
I found a temporary solution to this problem. Anyone having the same issue may use it:
def create_conditional_style(df):
    style=[]
    for col in df.columns:
        name_length = len(col)
        pixel = 50 + round(name_length*PIXEL_FOR_CHAR)
        pixel = str(pixel) + "px"
        style.append({'if': {'column_id': col}, 'minWidth': pixel})

    return style
For whoever takes this, https://github.com/plotly/dash-table/issues/740 has some more examples.
FYI - See https://dash.plotly.com/datatable/height for a discussion and an up to date list of workarounds:
I found a temporary solution to this problem. Anyone having the same issue may use it:
def create_conditional_style(df):
    style=[]
    for col in df.columns:
        name_length = len(col)
        pixel = 50 + round(name_length*PIXEL_FOR_CHAR)
        pixel = str(pixel) + "px"
        style.append({'if': {'column_id': col}, 'minWidth': pixel})

    return style
where to assign the returned style in the dash layout exactly please?
Hi, is this being reviewed at all? I still have the same problem without any easy fix.
I have the same issue as well. Currently using style_cell={'minWidth':70}, as a workaround.
I have adapted the @liberbey code to take into consideration, not only the header, but also the column content length as well as the data type:
def create_conditional_style_full(df):
	PADDING = 24
	PIXEL_FOR_CHAR = 6
	style=[]
	for col in df.columns:
		if df[col].dtype == 'object':
			try:
				df[col] = pd.to_datetime(df[col])
			except ValueError:
				pass
		col_list = df[col].values.tolist()
		col_list = [s if type(s) is str else str(s) for s in col_list]
		col_list.append(col)
		name_length = len(max(col_list, key=len))
		pixel = PADDING + round(name_length*PIXEL_FOR_CHAR)
		pixel = str(pixel) + 'px'
		if pd.api.types.infer_dtype(df[col]) == 'string' or pd.api.types.infer_dtype(df[col]) == 'boolean' and not pd.api.types.is_datetime64_any_dtype(df[col]):
			style.append({'if': {'column_id': col}, 'minWidth': pixel, 'textAlign': 'left'})
		else:
			style.append({'if': {'column_id': col}, 'minWidth': pixel})
	return style
Then you add this to your layout like:
style_cell_conditional=create_conditional_style(df_weight),
In the function you will need to adjust PADDING and PIXEL_FOR_CHAR until your table looks OK.
Finally, in the layout, replace df_weight with the name of your dataframe.