Stacked area timeseries plots incorrectly with gaps
Describe the bug The timeseries widget in the UI has a bug when in stacked area mode. It leaves gaps in the timeseries. I believe this is happening because for some subseries in a given time window, there are no data points. So for those series, the missing series datapoints show up as gaps.
For example, if service A always has HTTP requests in any interval, but service B does not always have HTTP requests, there will be no record for service B in the time point, but the chart is expecting a record that says 0 requests.
To Reproduce I've attached a vis spec and pxl script that I believe should reproduce the issue for most clusters. GitHub won't let me upload .pxl and .json files for some reason, so I changed the extensions. pxl.txt vis.txt
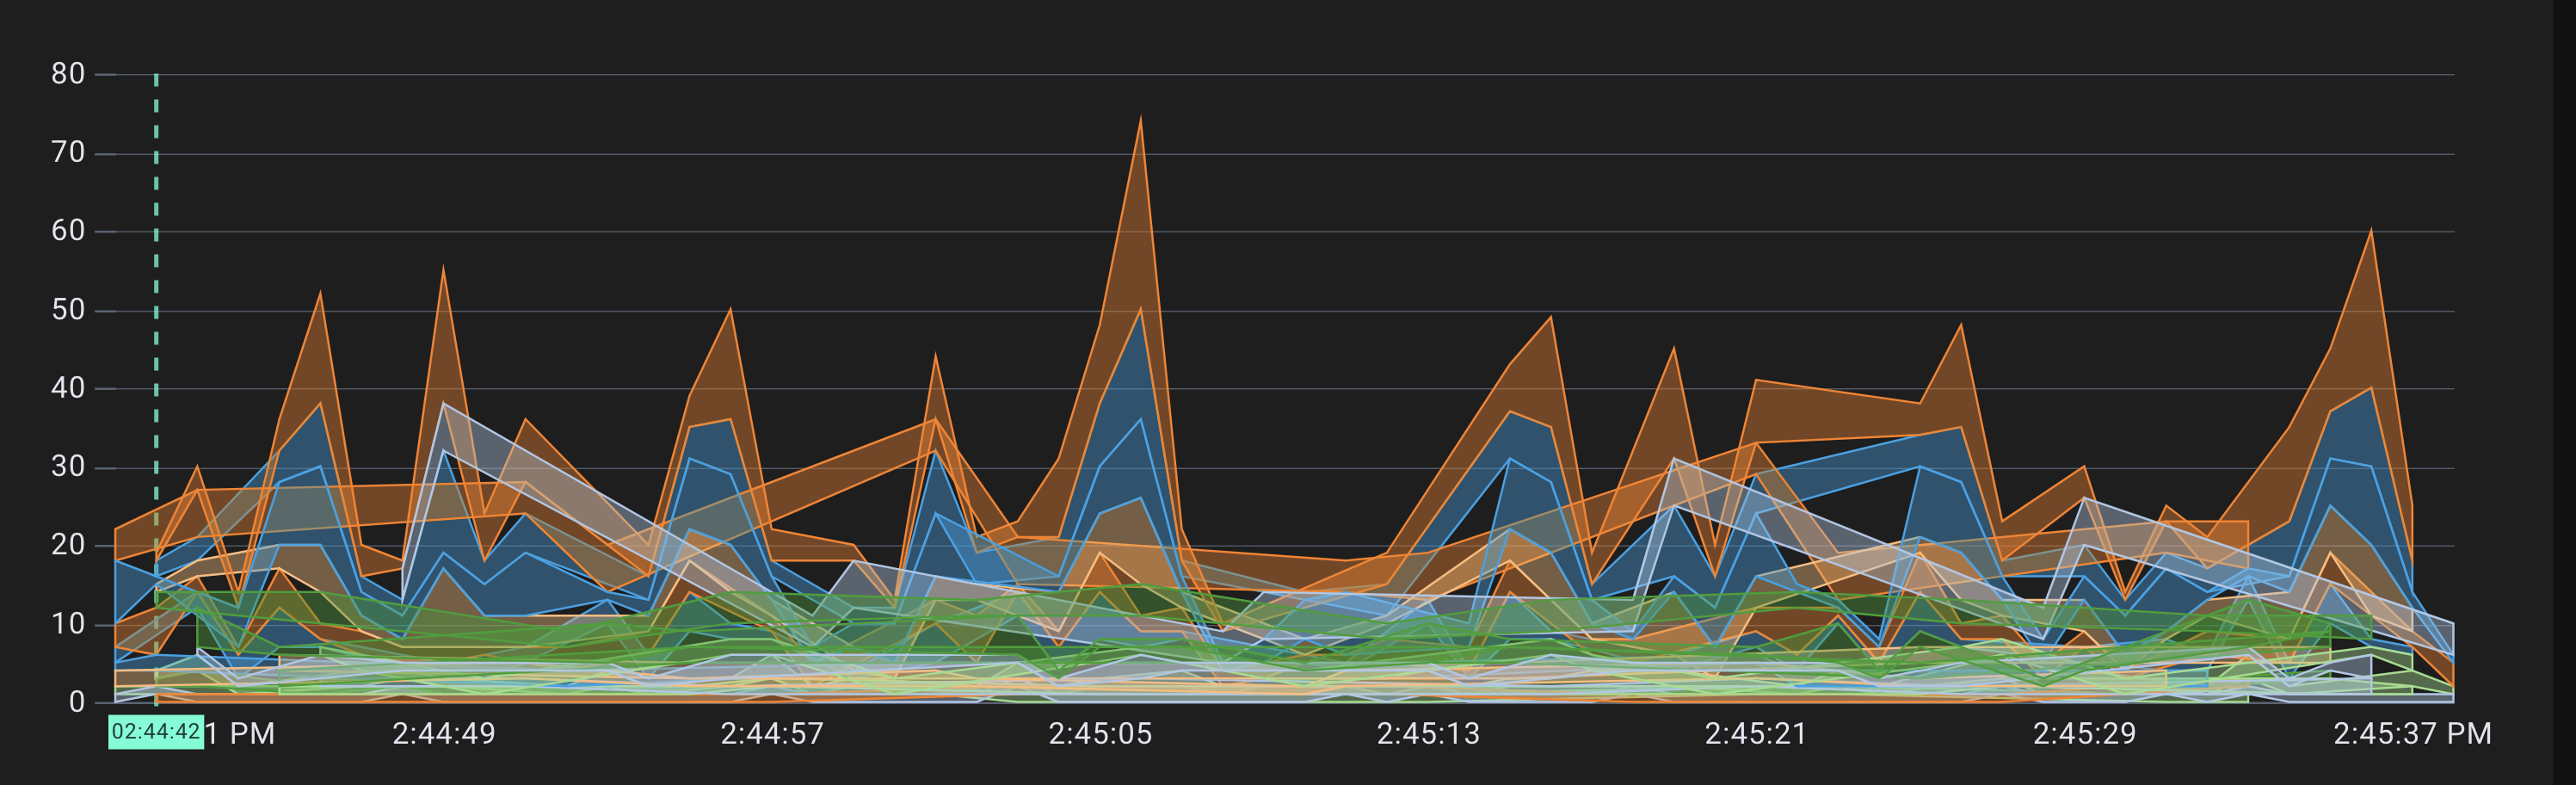
Expected behavior Expected the screenshot to render without gaps
Screenshots