Node Network Traffic counters reporting very large values
Describe the bug
When viewing the px/nodes and px/node scripts, two of the nodes in a DigitalOcean Kubernetes cluster are reporting very large values for both sent and received network traffic at irregular intervals.
To Reproduce Steps to reproduce the behavior:
- Go to a cluster in Pixie
- Click on script
px/nodes - Set
start_timeto-5h(any value works, but trends are easier to see with a larger window) - Click "Run"
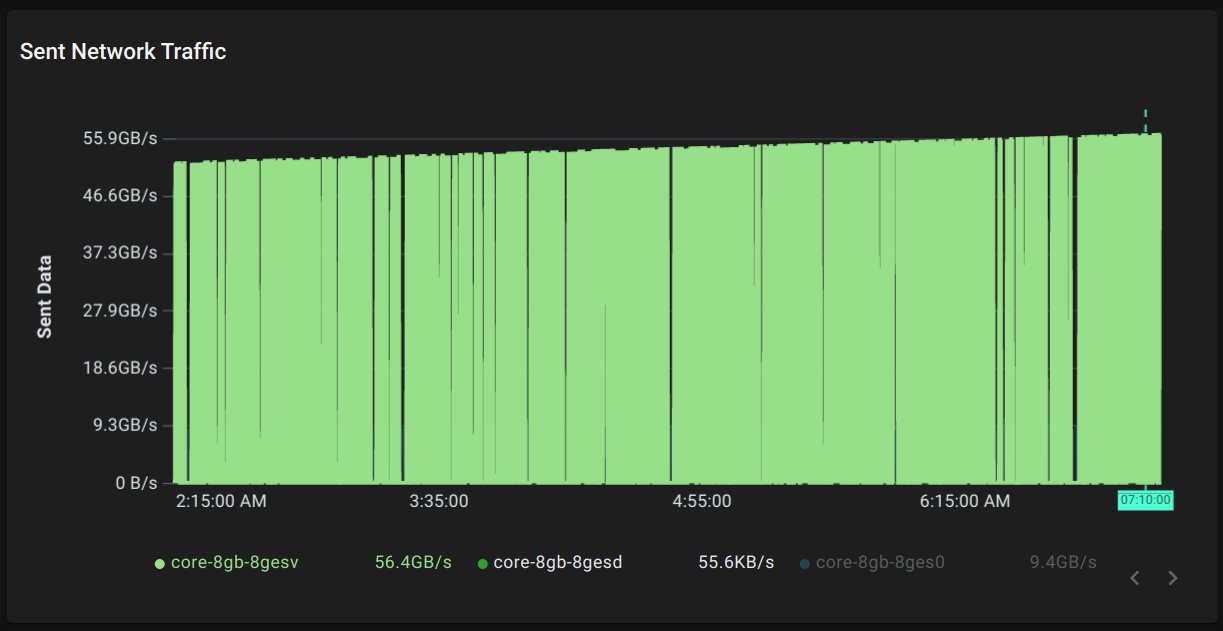
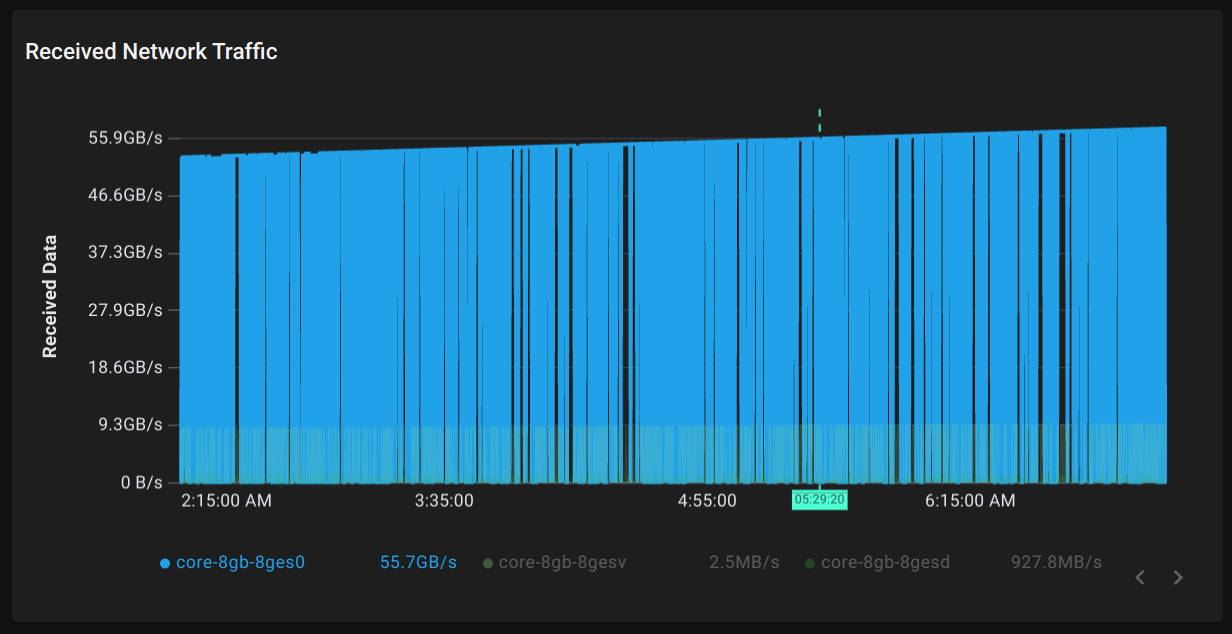
- Scroll down to "Sent Network Traffic" and "Received Network Traffic"
Expected behavior I expect to see a graph indicating steady amounts of traffic, with occasional spikes.
Screenshots
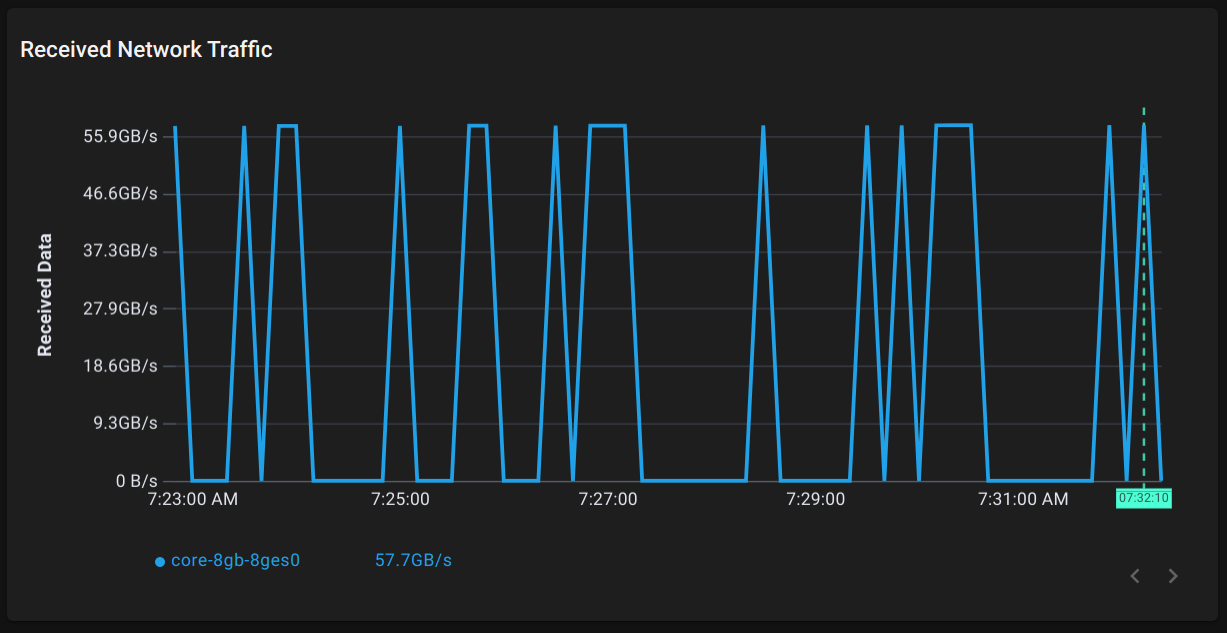
Using a 10-minute window to showcase the irregular intervals:
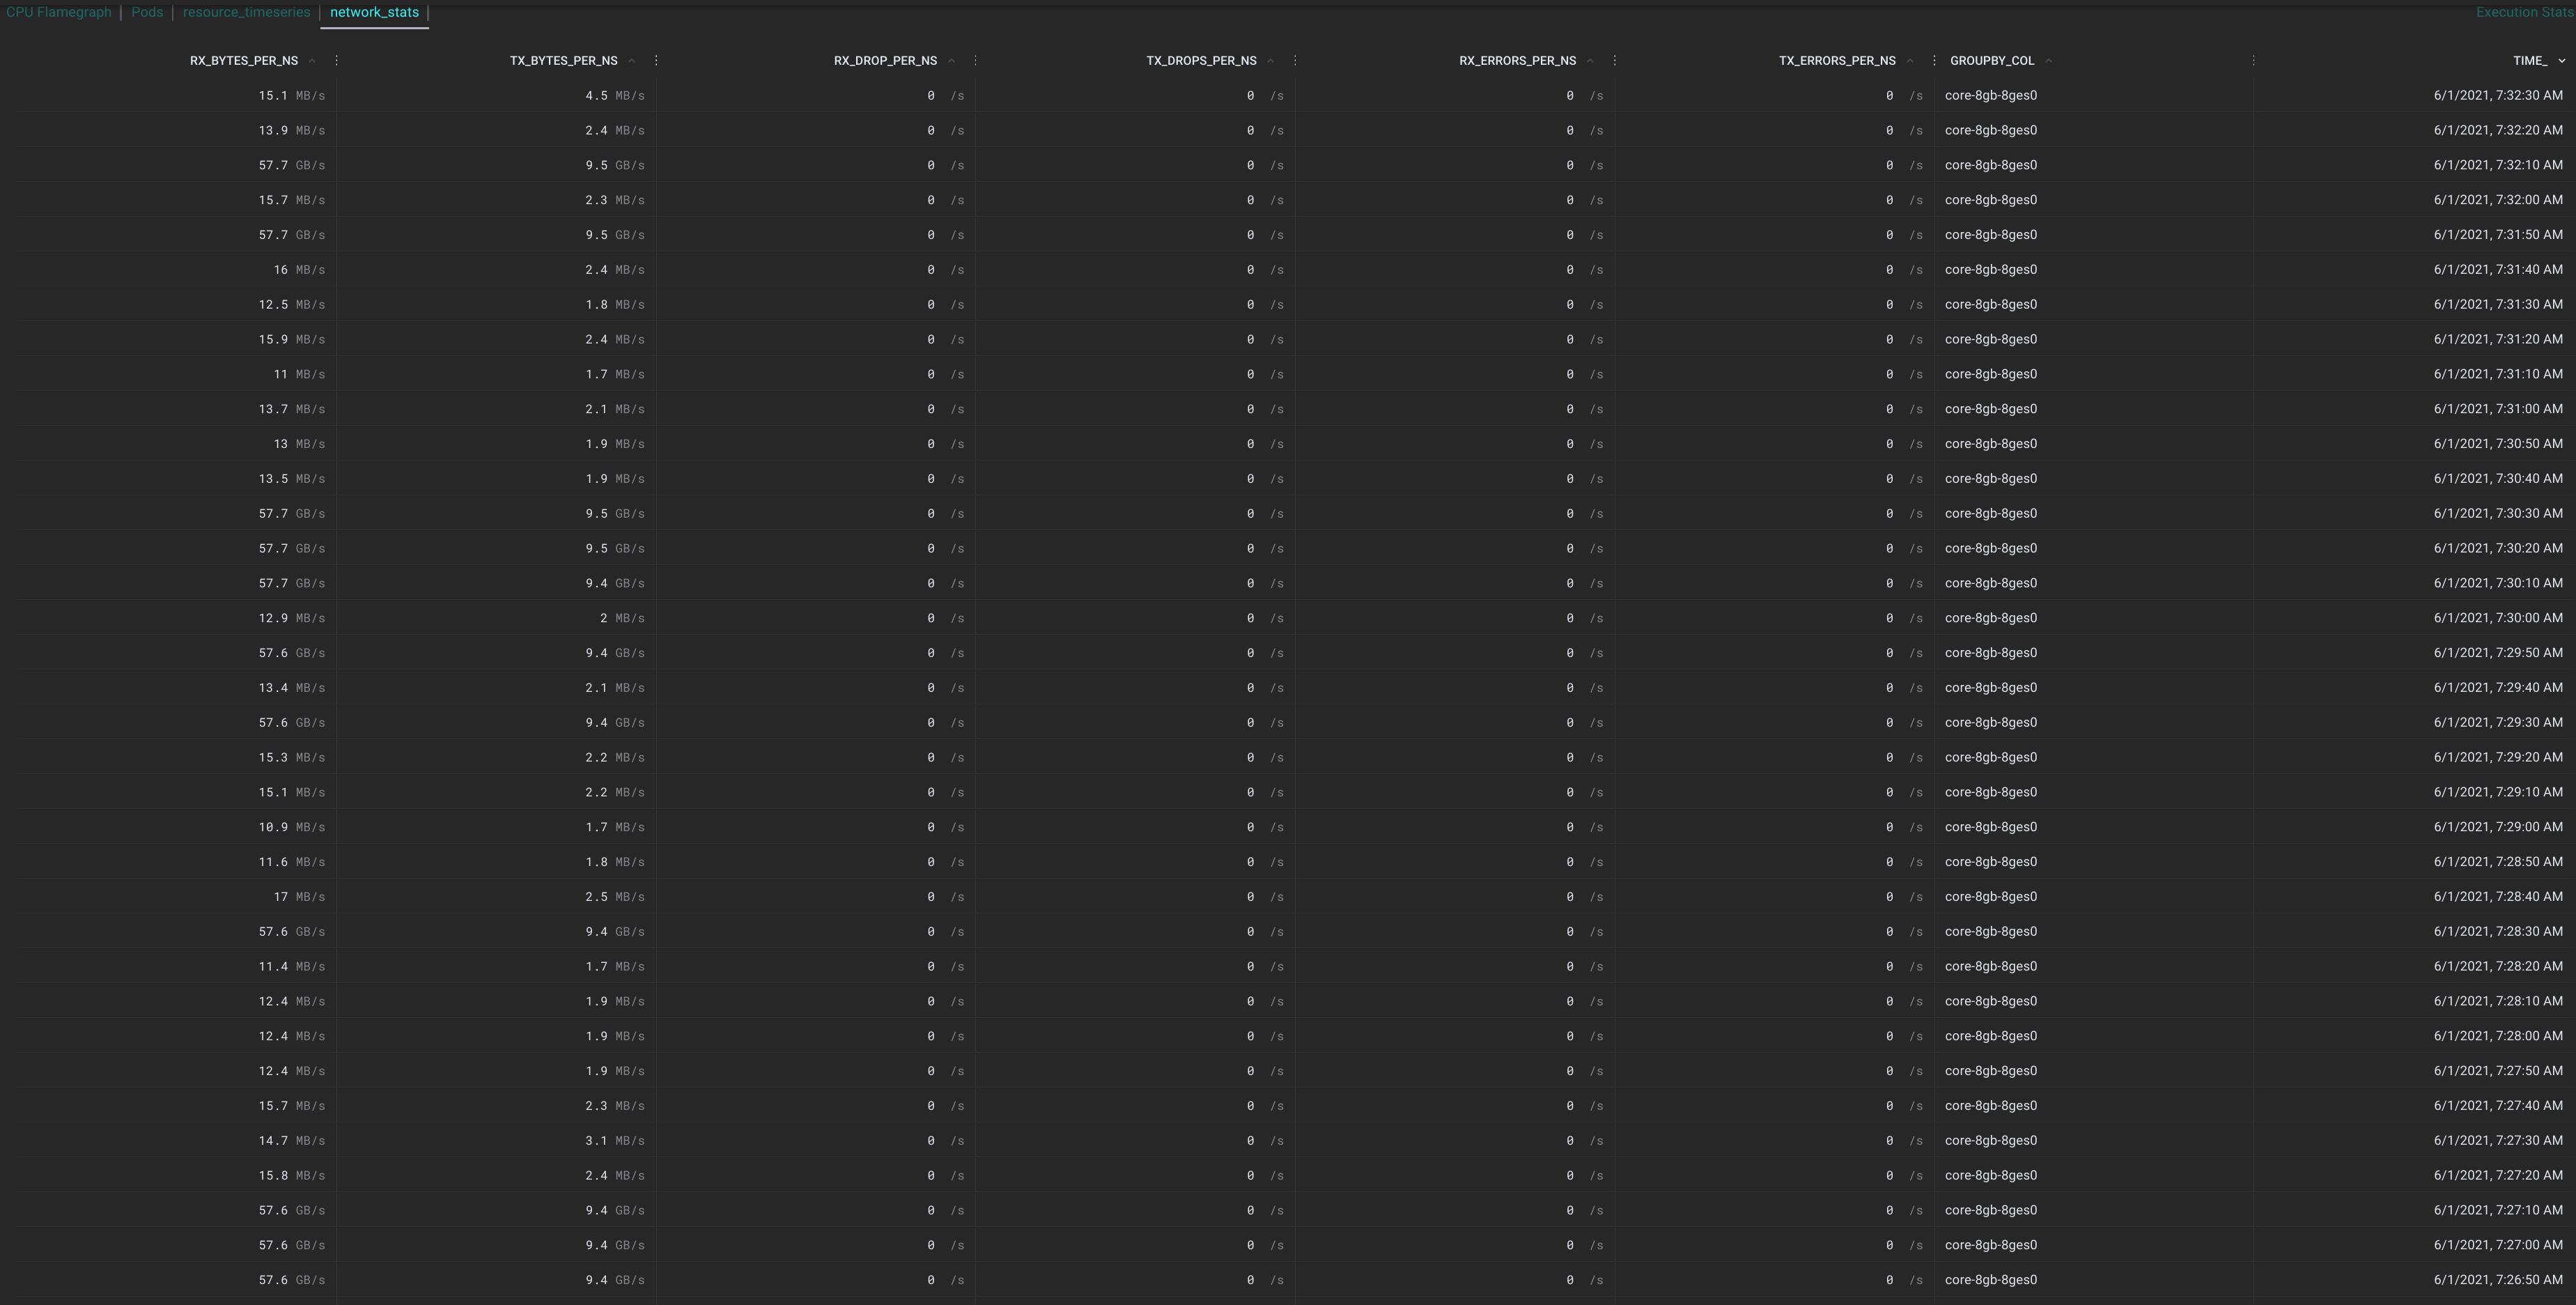
Tabular view of data from screenshot above:
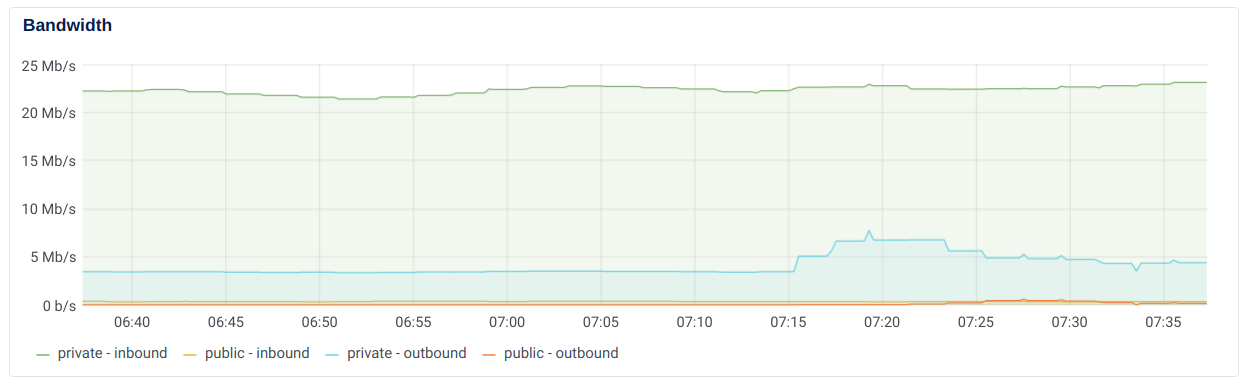
Graph of node traffic from DigitalOcean's console:
Logs Please attach the logs by running the following command:
./px collect-logs
App information (please complete the following information):
- Pixie version: 0.5.12+Distribution.a945b68.20210525150228.1
- K8s cluster version: 1.20.2-do.0
Additional context There's not really anything running on this cluster that should explain any kind of spikes in network traffic. It is a disposable cluster, and normally I would have deleted it and started over by now. I'm trying to leave it alone just in case it's useful for debugging this behavior.