The problem of flaming graph symbolization
Describe the bug I built 1 demo monitoring system by myself and the target application for monitoring is the official px-sock-shop application. I found that through the front-end flame chart, I couldn't locate the reason why it took 1.7s at all, because the grid up the flame chart, which shows all 0x00007f39a6723db something like this, is not converted into human readable form. For example:
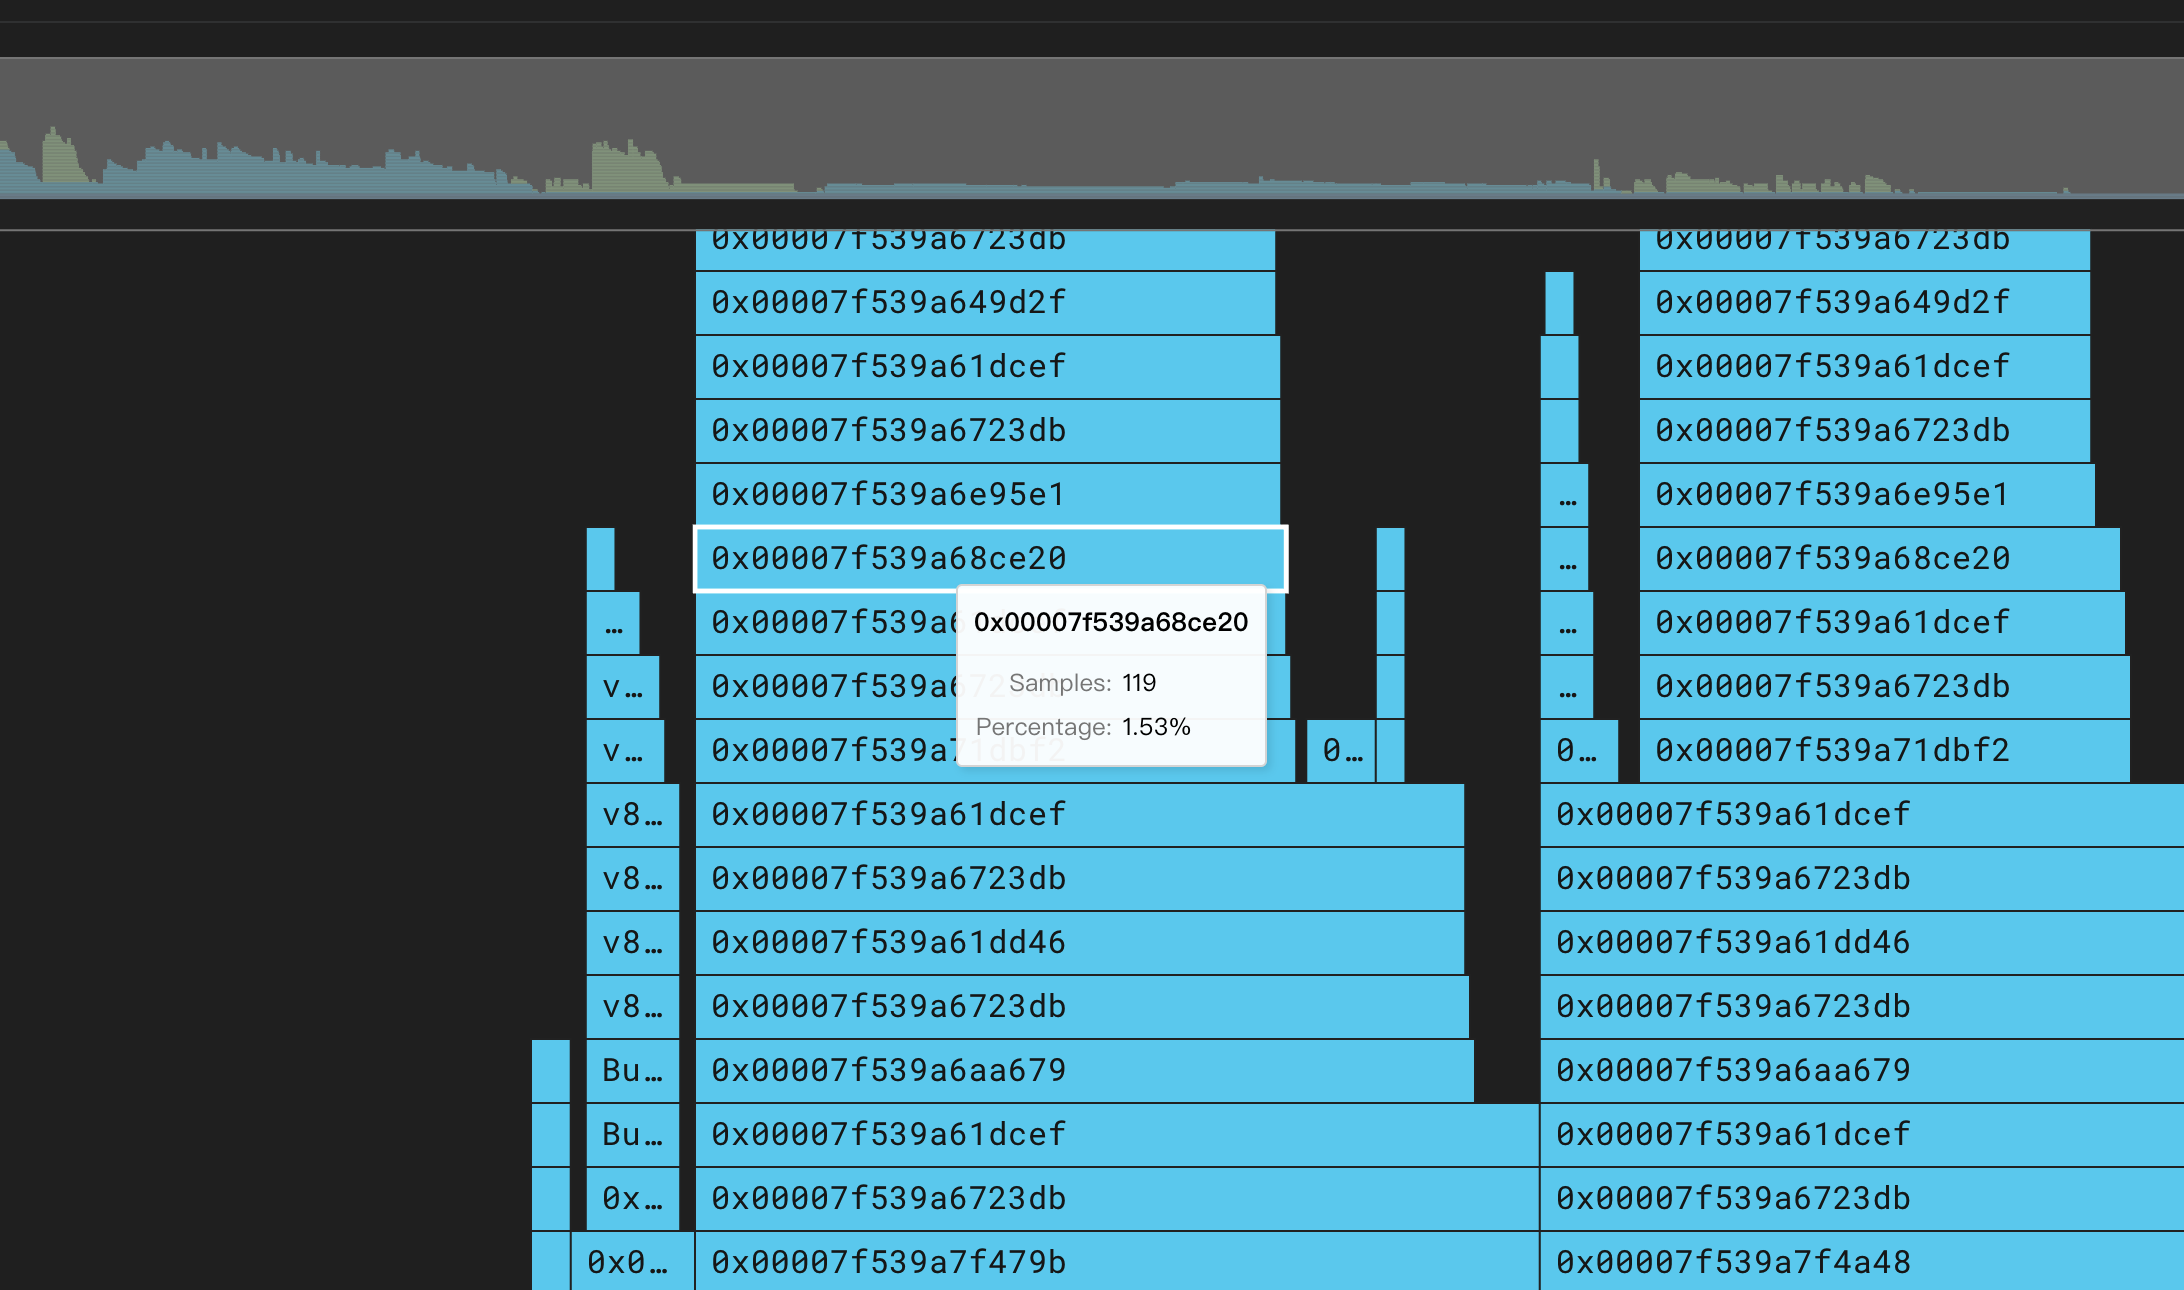
In addition, the flame chart of the Java process, I can only see the Java code execution of a very few squares, and are also the official Java classes, the application itself does not see the method-related squares, and I found that there are also similar to 0x000 such a grid, and I checked the value of the PL_PROFILER_JAVA_SYMBOLS environment variable, set to true.
To Reproduce https://withpixie.ai/invite?invite_token=eyJhbGciOiJIUzI1NiIsInR5cCI6IkpXVCJ9.eyJleHAiOjE2ODA3NTk2NzcsInN1YiI6IjdjOTBlODNhLThiNDktNDUwNy1hMGYzLWUwZWRiMzJiODk2YSJ9.lA7lGvjEp3kxY64_5viRBVwzDkmlpgJMGG9AVxVqSlg
You can use the invitation link above to see the actual flame chart in action.
Hi @asasas234 ,
Is it possible that you are looking at a NodeJS application? We do not support symbolization for NodeJS yet. Although we plan to add NodeJS symbolization, we are not sure how to set expectations for when that feature may become available (we are not working on that feature right now).
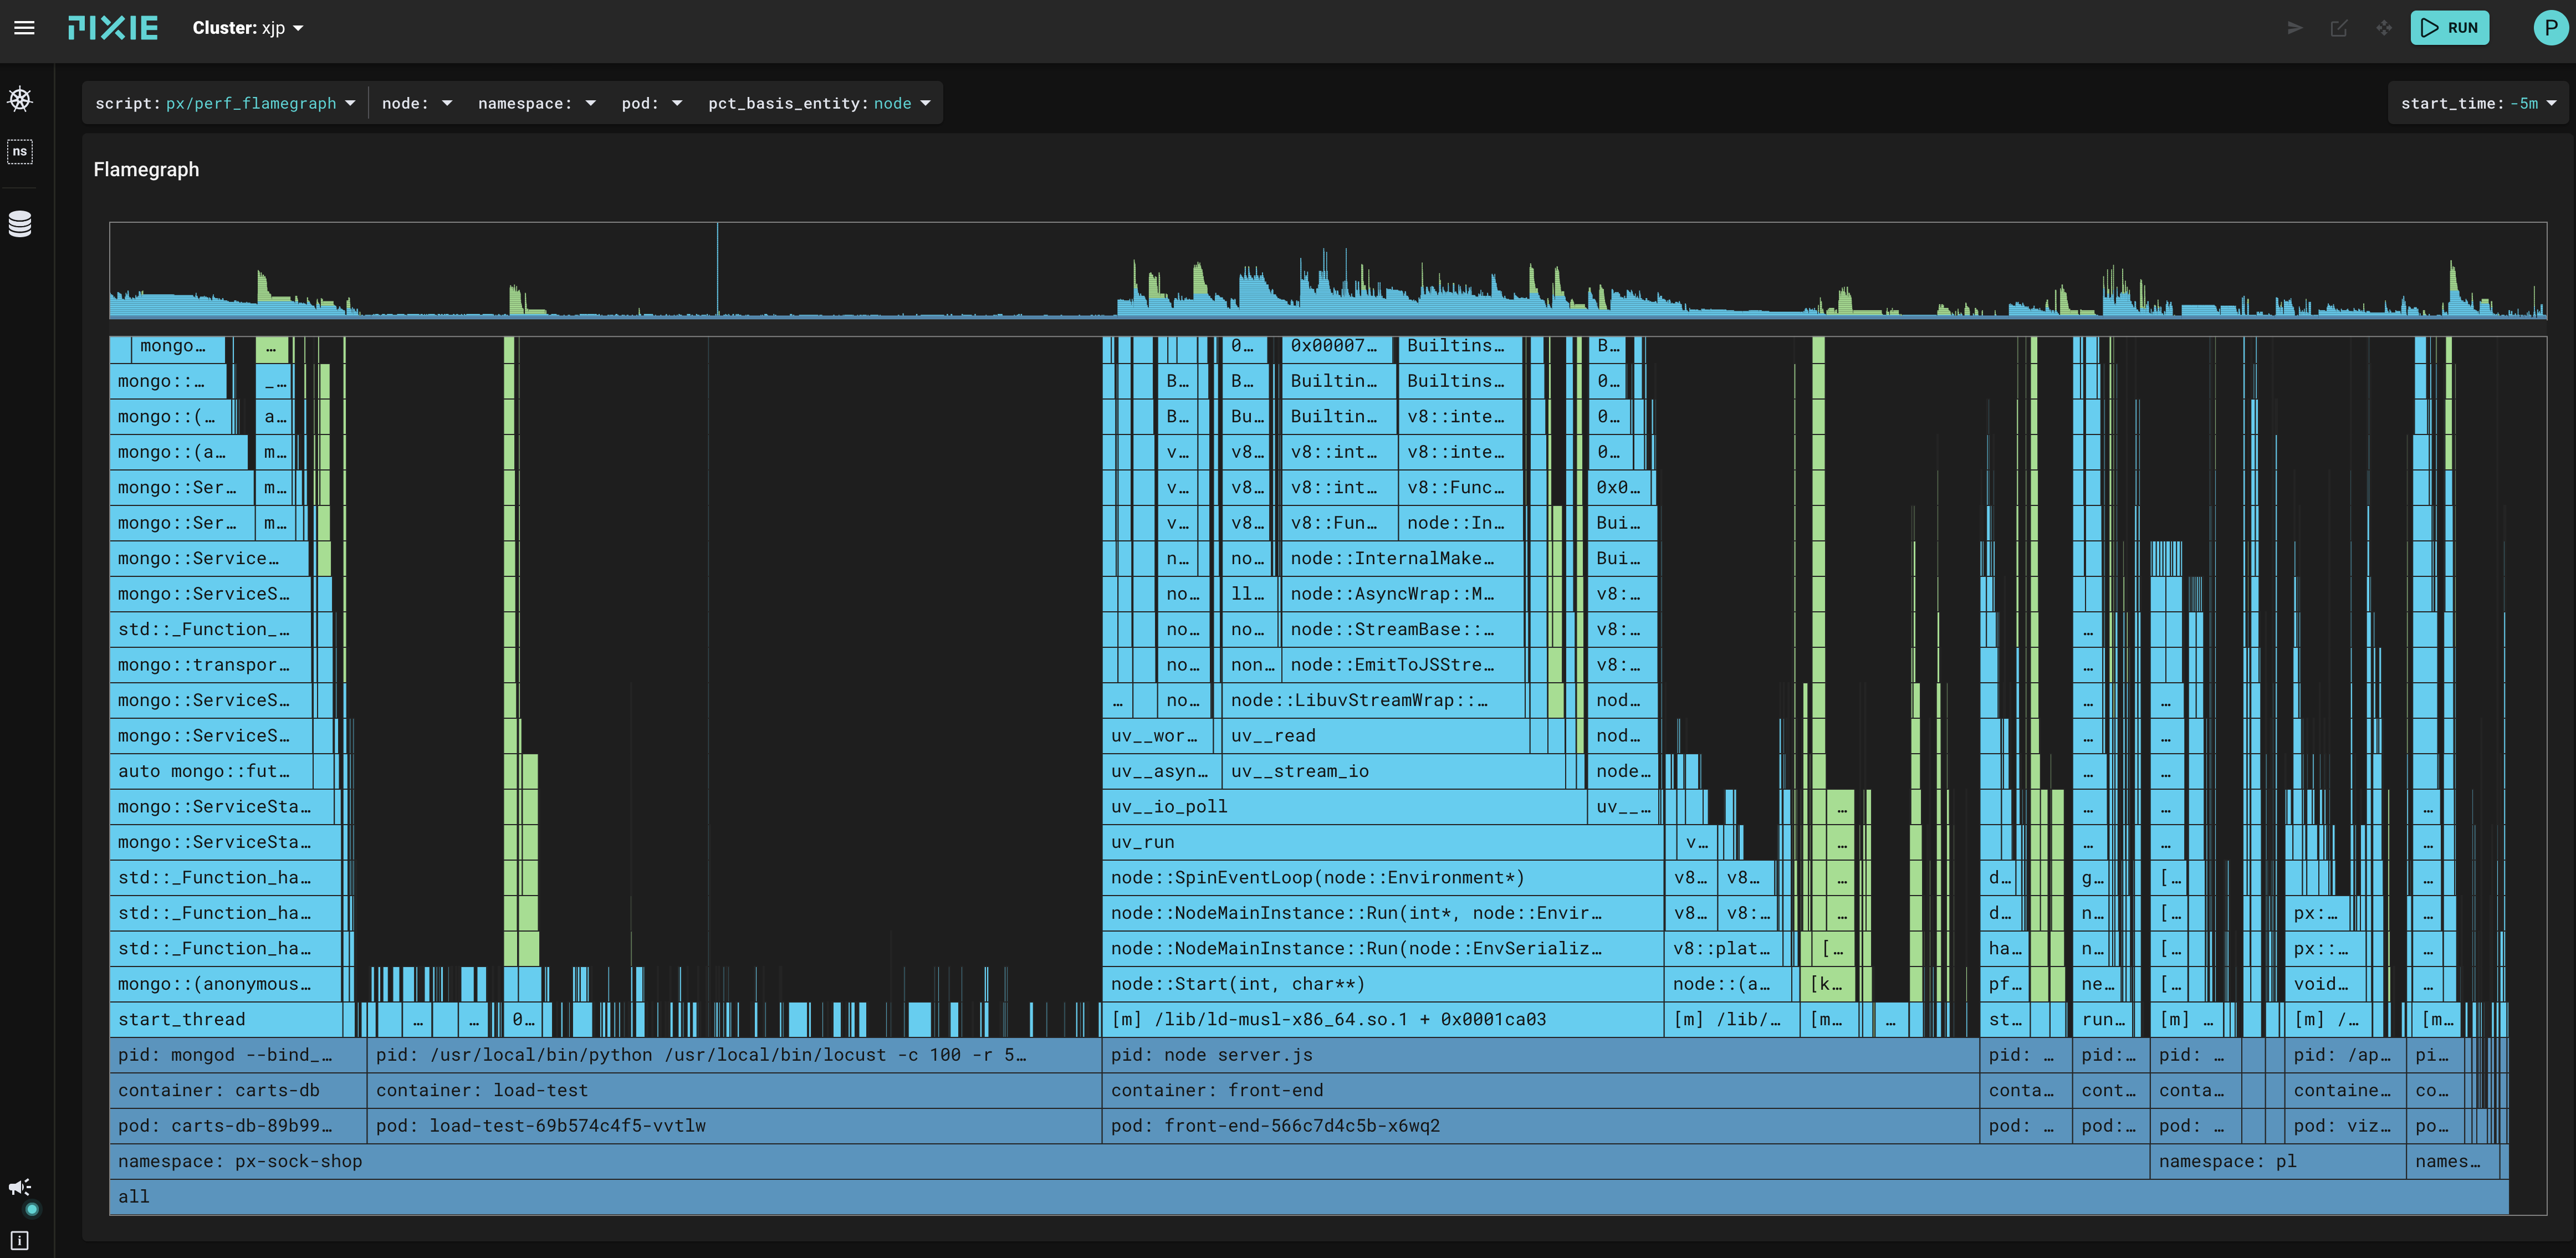
I clicked through the link you provided and found a cluster named xjp. I was not able to see exactly what you saw, but I am including a fully zoomed out image of the flamegraph I found so that you can point me the region of the flamegraph to look at.
@etep hi, The following diagram is an official example of 1 Java system, and you can see that there will also be symbolic problems at: https://work.withpixie.ai/live/clusters/xjp/namespaces/px-sock-shop/pods/carts-7c47dff488- kx4vg?start_time=-5m
In addition to the symbolization problem, I think this flame map collection of the stack, seems to be very incomplete, I only found a limited number of Java classes and methods, the cart system's own class completely missed.
Finally I have 1 more question, this flame chart, what is the collection time range indicated? The same time range as the one selected above? The last 5 minutes?
If you can't see the information from the link I posted, you can also go directly to the px-sock-shop namespace and see the flame chart for the carts project
Hi @asasas234 ,
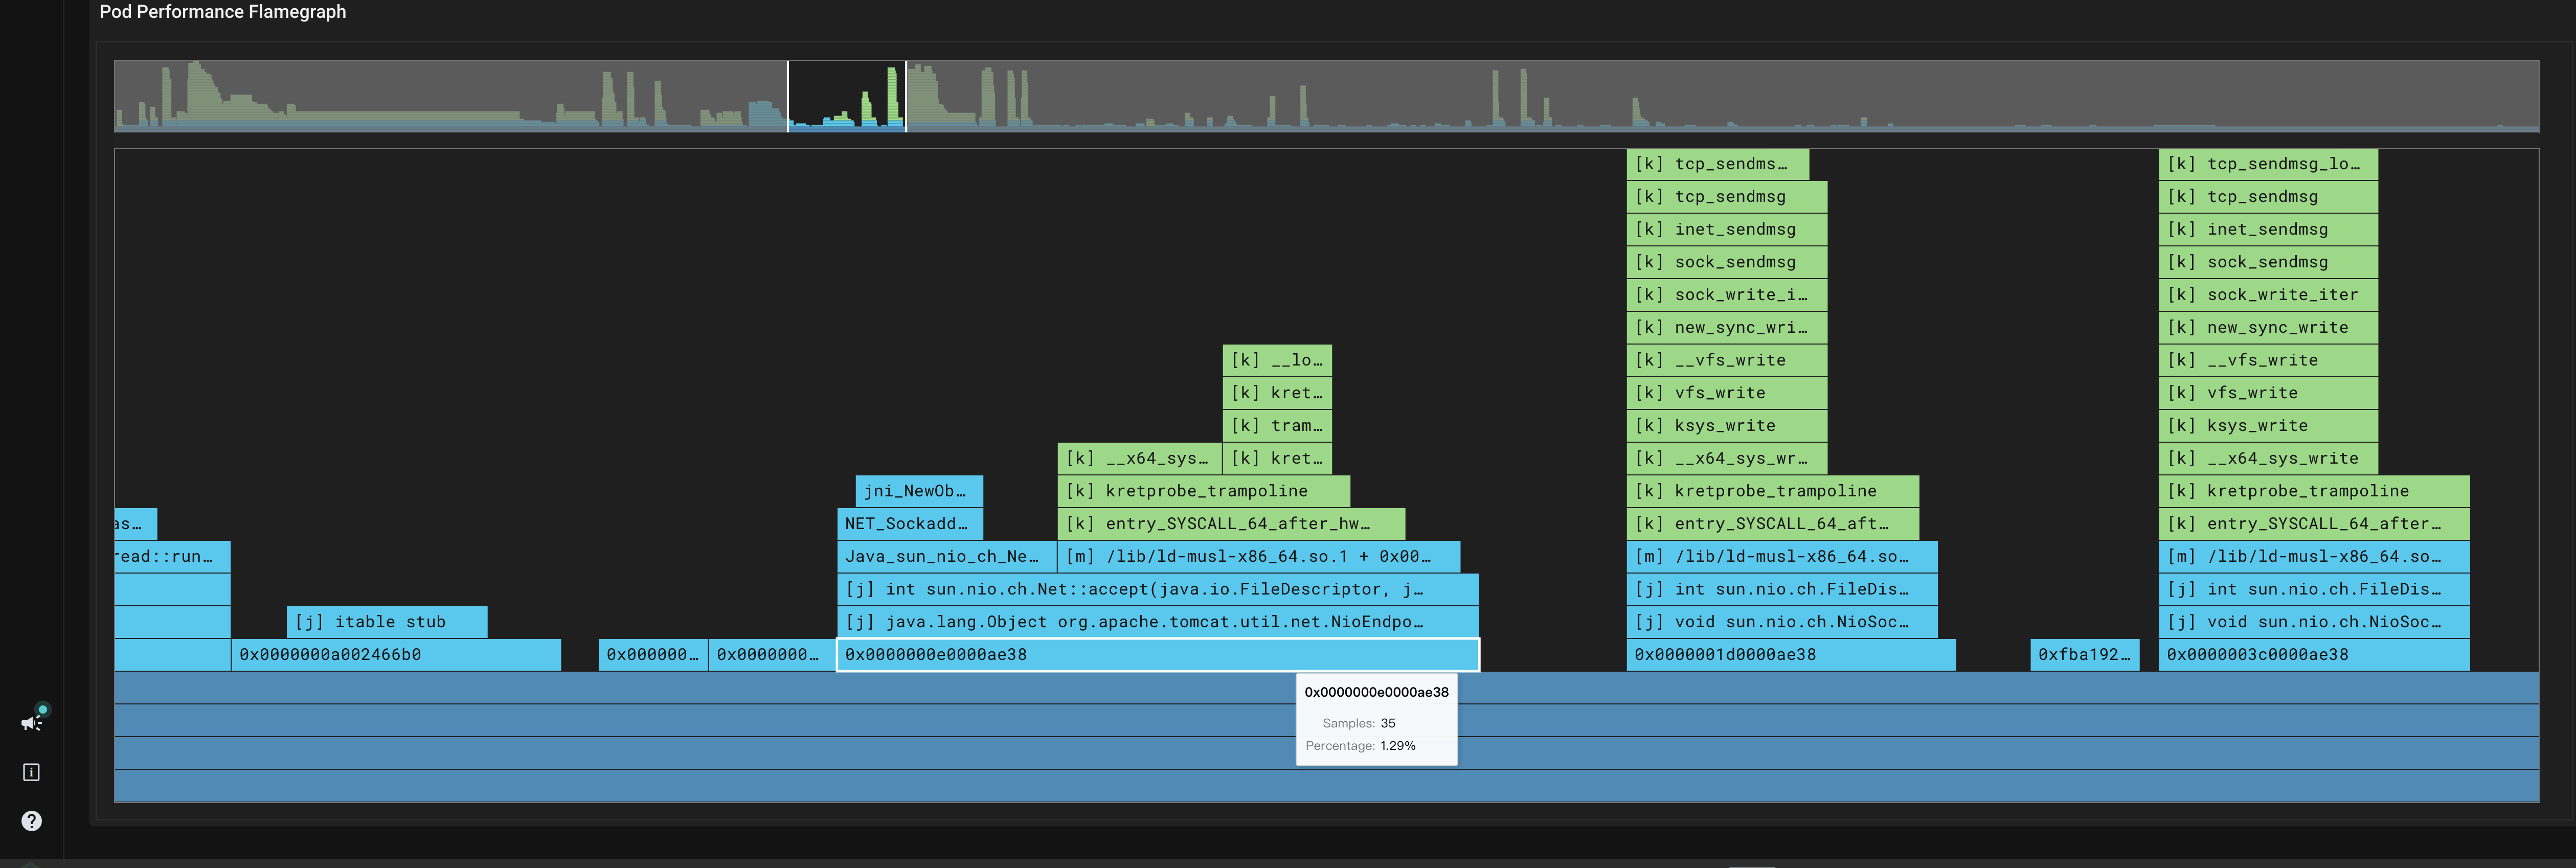
The flamegraph image you provide looks good to me. The "address" at the root of the stack 0xe0000ae38 is probably not a valid instruction pointer address. The kernel stack frame walker (which we implicitly use through eBPF) can pick up some stray values at the base of the stack, i.e. before it realizes that there is no more stack to walk. We have considered implementing a heuristic to filter those out, but have not put that on our roadmap. Since the address at the bottom of the stack is almost invariably pointing into the root of your program (be that libc/main or the jvm, or node, or python), it is usually not interesting from a perf perspective, i.e. any interesting perf insights will be found elsewhere.
The time frame, is, as you observe, based on the time window in the GUI:
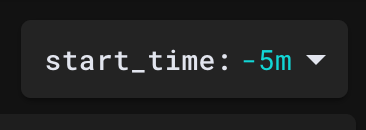 For the screen shot I provide, it means "previous 5 minutes" (relative to the moment when I clicked "run").
Sock shop may not be very useful for you to get confidence in the perf profiling feature: perhaps you don't have a good intuition about where sock shop does or should spend its time (neither do I have that intuition). If you are interested in Java, and you don't already have a Java application up, I suggest crafting a Java application that does something predictable, and then profiling it. If you need such an application, you can check out ours in src/stirling/source_connectors/perf_profiler/testing/java/ProfilerTest.java.
For Java stack trace walking, we strongly encourage use of -XX:+PreserveFramePointer. This preserves the frame pointer in the stack, and enables the kernel stack frame walker to find the correct stack trace.
@etep hi, I found that the carts app in Sock shop, the command line that starts it does not have -XX:+PreserveFramePointer set . However, when I looked at the pod definition for carts, I found that the env.
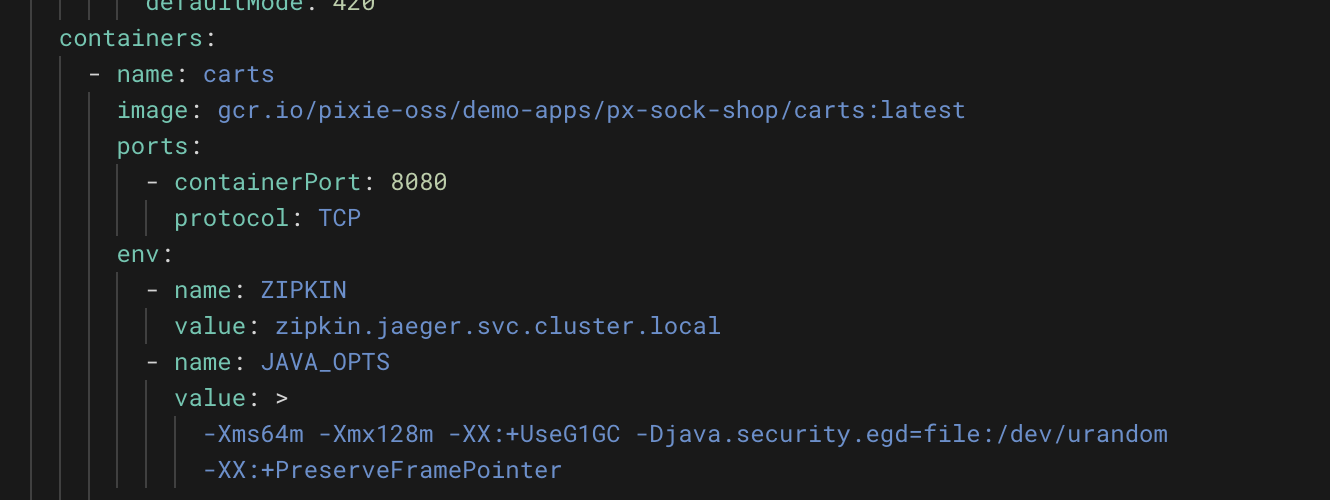
I was wondering, is there any way I can add -XX:+PreserveFramePointer to the carts system, or is there an official other demo system for Java with the -XX:+PreserveFramePointer parameter set correctly?
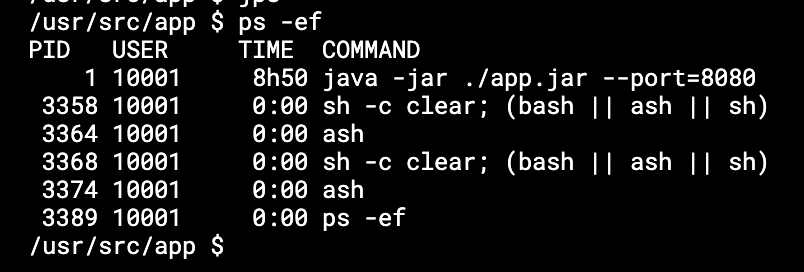
Here is a screenshot of my login to carts to check the Java startup parameters
@etep Thanks, I have no problem, by way of custom Dockerfile based on the original Carts image, I successfully added the -XX:+PreserveFramePointer startup parameter, the effect of displaying the flame chart I am more than satisfied, and successfully found out according to the flame chart is operating mongodb slow, but pixie does not seem to support mysql like support for Mongodb, resulting in the inability to see directly from the monitoring mongodb specific what requests are slower.
@etep I found that there are still problems with the flame graph when testing with our actual project. I want to know if there is a limit to its hierarchy? We are a Java project, and the request goes through Tomcat -> Spring MVC before it reaches our actual project code, but the flame graph has already terminated.
Hi @asasas234,
Could you take a look at the script px/stirling_errors? There will be a row populated for each process that does not have frame pointers enabled. My best guess (based on the description that the flame graph is terminated) is that the frame pointers are not enabled somewhere.
Here is a screen shot of what I saw when I setup a cluster to show this type of error:
@etep Below are the parameters I added to the original Java startup parameters in order to display the flame graph.
-XX:+PreserveFramePointer -DPL_PROFILER_JAVA_SYMBOLS=true
@etep https://work.withpixie.ai/live/clusters/247421154832530382-c6d4468c2d4da4dfa93686b32c7866633/namespaces/ratel/pods/international-platform-business.prod.ali.ratel-pod-deploy-gwg27?start_time=-5m This is the flame graph URL for me to view this process.