tidb
 tidb copied to clipboard
ANALYZE TABLE execution time depending on number of partitions
Bug Report
Please answer these questions before submitting your issue. Thanks!
1. Minimal reproduce step (Required)
tidb> show create table sbtest1;
+---------+----------------------------------------------------------------------------------------------------------------------------------------------------------------------------------------------------------------------------------------------------------------------------------------------------------------------------------------------------------------------------------------------------------------------------------------------------------------------------------------------------------------------------------------------------------------------------------------------------------------------------------------------------------------------------------------------------------------------------------------------------------------------------------------------------------------------------------------------------------------------------------------------------------------------------------------------------------------------------------------------------------------------------------------------------------------------+
| Table   | Create Table                                                                                                                                                                                                                                                                                                                                                                                                                                                                                                                                                                                                                                                                                                                                                                                                                                                                                                                                                                                                                                                     |
+---------+----------------------------------------------------------------------------------------------------------------------------------------------------------------------------------------------------------------------------------------------------------------------------------------------------------------------------------------------------------------------------------------------------------------------------------------------------------------------------------------------------------------------------------------------------------------------------------------------------------------------------------------------------------------------------------------------------------------------------------------------------------------------------------------------------------------------------------------------------------------------------------------------------------------------------------------------------------------------------------------------------------------------------------------------------------------------+
| sbtest1 | CREATE TABLE `sbtest1` (
  `id` int(11) NOT NULL AUTO_INCREMENT,
  `k` int(11) NOT NULL DEFAULT '0',
  `c` char(120) NOT NULL DEFAULT '',
  `pad` char(60) NOT NULL DEFAULT '',
  PRIMARY KEY (`id`) /*T![clustered_index] CLUSTERED */,
  KEY `k_1` (`k`)
) ENGINE=InnoDB DEFAULT CHARSET=utf8mb4 COLLATE=utf8mb4_bin AUTO_INCREMENT=10138618
PARTITION BY RANGE (`id`)
(PARTITION `p0` VALUES LESS THAN (800000),
 PARTITION `p1` VALUES LESS THAN (1600000),
 PARTITION `p2` VALUES LESS THAN (2400000),
 PARTITION `p3` VALUES LESS THAN (3200000),
 PARTITION `p4` VALUES LESS THAN (4000000),
 PARTITION `p5` VALUES LESS THAN (4800000),
 PARTITION `p6` VALUES LESS THAN (5600000),
 PARTITION `p7` VALUES LESS THAN (6400000),
 PARTITION `p8` VALUES LESS THAN (7200000),
 PARTITION `p9` VALUES LESS THAN (8000000),
 PARTITION `p10` VALUES LESS THAN (8800000),
 PARTITION `p11` VALUES LESS THAN (9600000),
 PARTITION `p12` VALUES LESS THAN (10400000),
 PARTITION `p13` VALUES LESS THAN (11200000),
 PARTITION `pMax` VALUES LESS THAN (MAXVALUE)) |
+---------+----------------------------------------------------------------------------------------------------------------------------------------------------------------------------------------------------------------------------------------------------------------------------------------------------------------------------------------------------------------------------------------------------------------------------------------------------------------------------------------------------------------------------------------------------------------------------------------------------------------------------------------------------------------------------------------------------------------------------------------------------------------------------------------------------------------------------------------------------------------------------------------------------------------------------------------------------------------------------------------------------------------------------------------------------------------------+
1 row in set (0,00 sec)

tidb> select count(*) from sbtest1;
+----------+
| count(*) |
+----------+
| 10000000 |
+----------+
1 row in set (0,01 sec)

tidb> analyze table sbtest1 partition p0;
Query OK, 0 rows affected, 1 warning (2,71 sec)

tidb> analyze table sbtest1 partition p0,p1;
Query OK, 0 rows affected, 2 warnings (3,42 sec)

tidb> analyze table sbtest1 partition p0,p1,p2;
Query OK, 0 rows affected, 3 warnings (4,12 sec)

tidb> analyze table sbtest1 partition p0,p1,p2,p3,p4,p5;
Query OK, 0 rows affected, 6 warnings (7,01 sec)

tidb> analyze table sbtest1;
Query OK, 0 rows affected, 15 warnings (13,23 sec)

tidb> show warnings;
+-------+------+---------------------------------------------------------------------------------------------+
| Level | Code | Message                                                                                     |
+-------+------+---------------------------------------------------------------------------------------------+
| Note  | 1105 | Analyze use auto adjusted sample rate 0.139168 for table sbdynamic.sbtest1's partition p0   |
| Note  | 1105 | Analyze use auto adjusted sample rate 0.139042 for table sbdynamic.sbtest1's partition p1   |
| Note  | 1105 | Analyze use auto adjusted sample rate 0.138688 for table sbdynamic.sbtest1's partition p2   |
| Note  | 1105 | Analyze use auto adjusted sample rate 0.139260 for table sbdynamic.sbtest1's partition p3   |
| Note  | 1105 | Analyze use auto adjusted sample rate 0.138750 for table sbdynamic.sbtest1's partition p4   |
| Note  | 1105 | Analyze use auto adjusted sample rate 0.139360 for table sbdynamic.sbtest1's partition p5   |
| Note  | 1105 | Analyze use auto adjusted sample rate 0.139569 for table sbdynamic.sbtest1's partition p6   |
| Note  | 1105 | Analyze use auto adjusted sample rate 0.139443 for table sbdynamic.sbtest1's partition p7   |
| Note  | 1105 | Analyze use auto adjusted sample rate 0.139351 for table sbdynamic.sbtest1's partition p8   |
| Note  | 1105 | Analyze use auto adjusted sample rate 0.139379 for table sbdynamic.sbtest1's partition p9   |
| Note  | 1105 | Analyze use auto adjusted sample rate 0.140082 for table sbdynamic.sbtest1's partition p10  |
| Note  | 1105 | Analyze use auto adjusted sample rate 0.139198 for table sbdynamic.sbtest1's partition p11  |
| Note  | 1105 | Analyze use auto adjusted sample rate 0.210632 for table sbdynamic.sbtest1's partition p12  |
| Note  | 1105 | Analyze use auto adjusted sample rate 1.000000 for table sbdynamic.sbtest1's partition p13  |
| Note  | 1105 | Analyze use auto adjusted sample rate 1.000000 for table sbdynamic.sbtest1's partition pMax |
+-------+------+---------------------------------------------------------------------------------------------+
15 rows in set (0,00 sec)

tidb> select partition_name,table_rows from information_schema.partitions where table_name = 'sbtest1' and table_schema = 'sbdynamic';
+----------------+------------+
| partition_name | table_rows |
+----------------+------------+
| p0             |     790410 |
| p1             |     791129 |
| p2             |     793149 |
| p3             |     789887 |
| p4             |     792791 |
| p5             |     789320 |
| p6             |     788141 |
| p7             |     788850 |
| p8             |     789375 |
| p9             |     789215 |
| p10            |     785254 |
| p11            |     790240 |
| p12            |     522239 |
| p13            |          0 |
| pMax           |          0 |
+----------------+------------+
15 rows in set (0,01 sec)

tidb> select @@tidb_partition_prune_mode;
+-----------------------------+
| @@tidb_partition_prune_mode |
+-----------------------------+
| dynamic                     |
+-----------------------------+
1 row in set (0,00 sec)

tidb> set @@tidb_partition_prune_mode='static';
Query OK, 0 rows affected (0,00 sec)

tidb> analyze table sbtest1;
Query OK, 0 rows affected, 15 warnings (11,59 sec)

tidb> analyze table sbtest1 partition p0;
Query OK, 0 rows affected, 1 warning (1,44 sec)

tidb> analyze table sbtest1 partition p0,p1,p2,p3,p4,p5;
Query OK, 0 rows affected, 6 warnings (5,62 sec)

tidb> show warnings;
+-------+------+-------------------------------------------------------------------------------------------+
| Level | Code | Message                                                                                   |
+-------+------+-------------------------------------------------------------------------------------------+
| Note  | 1105 | Analyze use auto adjusted sample rate 0.139168 for table sbdynamic.sbtest1's partition p0 |
| Note  | 1105 | Analyze use auto adjusted sample rate 0.139042 for table sbdynamic.sbtest1's partition p1 |
| Note  | 1105 | Analyze use auto adjusted sample rate 0.138688 for table sbdynamic.sbtest1's partition p2 |
| Note  | 1105 | Analyze use auto adjusted sample rate 0.139260 for table sbdynamic.sbtest1's partition p3 |
| Note  | 1105 | Analyze use auto adjusted sample rate 0.138750 for table sbdynamic.sbtest1's partition p4 |
| Note  | 1105 | Analyze use auto adjusted sample rate 0.139360 for table sbdynamic.sbtest1's partition p5 |
+-------+------+-------------------------------------------------------------------------------------------+
6 rows in set (0,00 sec)

tidb> use sbnopart
Reading table information for completion of table and column names
You can turn off this feature to get a quicker startup with -A

Database changed
tidb> analyze table sbtest1;
Query OK, 0 rows affected, 1 warning (2,42 sec)

tidb> show warnings;
+-------+------+---------------------------------------------------------------------------+
| Level | Code | Message                                                                   |
+-------+------+---------------------------------------------------------------------------+
| Note  | 1105 | Analyze use auto adjusted sample rate 0.011000 for table sbnopart.sbtest1 |
+-------+------+---------------------------------------------------------------------------+
1 row in set (0,01 sec)

tidb> show create table sbtest1;
+---------+------------------------------------------------------------------------------------------------------------------------------------------------------------------------------------------------------------------------------------------------------------------------------------------------------------------------------------------------+
| Table   | Create Table                                                                                                                                                                                                                                                                                                                                   |
+---------+------------------------------------------------------------------------------------------------------------------------------------------------------------------------------------------------------------------------------------------------------------------------------------------------------------------------------------------------+
| sbtest1 | CREATE TABLE `sbtest1` (
  `id` int(11) NOT NULL AUTO_INCREMENT,
  `k` int(11) NOT NULL DEFAULT '0',
  `c` char(120) NOT NULL DEFAULT '',
  `pad` char(60) NOT NULL DEFAULT '',
  PRIMARY KEY (`id`) /*T![clustered_index] CLUSTERED */,
  KEY `k_1` (`k`)
) ENGINE=InnoDB DEFAULT CHARSET=utf8mb4 COLLATE=utf8mb4_bin AUTO_INCREMENT=10166202 |
+---------+------------------------------------------------------------------------------------------------------------------------------------------------------------------------------------------------------------------------------------------------------------------------------------------------------------------------------------------------+
1 row in set (0,01 sec)

tidb> select count(*) from sbtest1;
+----------+
| count(*) |
+----------+
| 10000000 |
+----------+
1 row in set (0,56 sec)

tidb> use sbdynamic;
Reading table information for completion of table and column names
You can turn off this feature to get a quicker startup with -A

Database changed
tidb> analyze table sbtest1 with 0.011 samplerate;
Query OK, 0 rows affected (9,44 sec)

tidb> analyze table sbtest1 with 0.11 samplerate;
Query OK, 0 rows affected (11,03 sec)
Also note that under @@tidb_partition_prune_mode = 'dynamic' it takes longer time than using static prune mode.
Also decreasing the sample rate does take less time, but not proportionally to the decrease (1/10 sample rate -> 8/10 consumed time).
2. What did you expect to see? (Required)
time to run ANALYZE TABLE not taking additional time per partition to run, resulting in too long execution time for tables with many partitions (currently we support 8192 partitions).
3. What did you see instead (Required)
Execution time depending on number of partitions
4. What is your TiDB version? (Required)
tidb_version(): Release Version: v6.1.0-alpha-482-g3ed672faa8
Edition: Community
Git Commit Hash: 3ed672faa82612d75f28bc73117febe1b53f605a
Git Branch: HEAD
UTC Build Time: 2022-05-30 12:20:38
GoVersion: go1.18
Race Enabled: false
TiKV Min Version: v3.0.0-60965b006877ca7234adaced7890d7b029ed1306
Check Table Before Drop: false
Maybe only use a sample/subset of the partitions to run analyze on for dynamic prune mode?
Example of the same table, but with 8192 hash partitions, taking 2 1/2 hour to complete ANALYZE TABLE:
tidb> analyze table sbtest1;
Query OK, 0 rows affected, 8192 warnings (2 hours 34 min 29,78 sec)

tidb> show create table sbtest1;
+---------+-----------------------------------------------------------------------------------------------------------------------------------------------------------------------------------------------------------------------------------------------------------------------------------------------------------------------------------------------------------------------------------------+
| Table   | Create Table                                                                                                                                                                                                                                                                                                                                                                            |
+---------+-----------------------------------------------------------------------------------------------------------------------------------------------------------------------------------------------------------------------------------------------------------------------------------------------------------------------------------------------------------------------------------------+
| sbtest1 | CREATE TABLE `sbtest1` (
  `id` int(11) NOT NULL AUTO_INCREMENT,
  `k` int(11) NOT NULL DEFAULT '0',
  `c` char(120) NOT NULL DEFAULT '',
  `pad` char(60) NOT NULL DEFAULT '',
  PRIMARY KEY (`id`) /*T![clustered_index] CLUSTERED */,
  KEY `k_1` (`k`)
) ENGINE=InnoDB DEFAULT CHARSET=utf8mb4 COLLATE=utf8mb4_bin AUTO_INCREMENT=10122187
PARTITION BY HASH (`id`) PARTITIONS 8192 |
+---------+-----------------------------------------------------------------------------------------------------------------------------------------------------------------------------------------------------------------------------------------------------------------------------------------------------------------------------------------------------------------------------------------+
1 row in set (0,00 sec)

tidb> select count(*) from sbtest1;
+----------+
| count(*) |
+----------+
| 10000000 |
+----------+
1 row in set (2,19 sec)
There seems to be three reasons:
- We use an auto-adjusted sample rate for each non-partition table and each partition, which collects roughly 100000 rows. So the more partitions, the more samples are collected.
- We launch one analyze job for each non-partition table and each partition. The more partitions, the more analyze jobs need to be executed. However, the number of analyze workers are limited by tidb_build_stats_concurrency(the default value is 4). Some analyze jobs are blocked until others are finished.
- SaveTableStatsToStorage seems slow.
I tested with following steps and I think the problems are solved now:
mysql> show create table sbtest1;
+---------+----------------------------------------------------------------------------------------------------------------------------------------------------------------------------------------------------------------------------------------------------------------------------------------------------------------------------------------------------------------------------------------------------------------------------------------------------------------------------------------------------------------------------------------------------------------------------------------------------------------------------------------------------------------------------------------------------------------------------------------------------------------------------------------------------------------------------------------------------------------------------------------------------------------------------------------------------------------------------------------------------------------------------------------------------------------------+
| Table   | Create Table                                                                                                                                                                                                                                                                                                                                                                                                                                                                                                                                                                                                                                                                                                                                                                                                                                                                                                                                                                                                                                                     |
+---------+----------------------------------------------------------------------------------------------------------------------------------------------------------------------------------------------------------------------------------------------------------------------------------------------------------------------------------------------------------------------------------------------------------------------------------------------------------------------------------------------------------------------------------------------------------------------------------------------------------------------------------------------------------------------------------------------------------------------------------------------------------------------------------------------------------------------------------------------------------------------------------------------------------------------------------------------------------------------------------------------------------------------------------------------------------------------+
| sbtest1 | CREATE TABLE `sbtest1` (
  `id` int(11) NOT NULL AUTO_INCREMENT,
  `k` int(11) NOT NULL DEFAULT '0',
  `c` char(120) NOT NULL DEFAULT '',
  `pad` char(60) NOT NULL DEFAULT '',
  PRIMARY KEY (`id`) /*T![clustered_index] CLUSTERED */,
  KEY `k_1` (`k`)
) ENGINE=InnoDB DEFAULT CHARSET=utf8mb4 COLLATE=utf8mb4_bin AUTO_INCREMENT=10071938
PARTITION BY RANGE (`id`)
(PARTITION `p0` VALUES LESS THAN (800000),
 PARTITION `p1` VALUES LESS THAN (1600000),
 PARTITION `p2` VALUES LESS THAN (2400000),
 PARTITION `p3` VALUES LESS THAN (3200000),
 PARTITION `p4` VALUES LESS THAN (4000000),
 PARTITION `p5` VALUES LESS THAN (4800000),
 PARTITION `p6` VALUES LESS THAN (5600000),
 PARTITION `p7` VALUES LESS THAN (6400000),
 PARTITION `p8` VALUES LESS THAN (7200000),
 PARTITION `p9` VALUES LESS THAN (8000000),
 PARTITION `p10` VALUES LESS THAN (8800000),
 PARTITION `p11` VALUES LESS THAN (9600000),
 PARTITION `p12` VALUES LESS THAN (10400000),
 PARTITION `p13` VALUES LESS THAN (11200000),
 PARTITION `pMax` VALUES LESS THAN (MAXVALUE)) |
+---------+----------------------------------------------------------------------------------------------------------------------------------------------------------------------------------------------------------------------------------------------------------------------------------------------------------------------------------------------------------------------------------------------------------------------------------------------------------------------------------------------------------------------------------------------------------------------------------------------------------------------------------------------------------------------------------------------------------------------------------------------------------------------------------------------------------------------------------------------------------------------------------------------------------------------------------------------------------------------------------------------------------------------------------------------------------------------+
1 row in set (0.00 sec)

mysql> select count(*) from sbtest1;
+----------+
| count(*) |
+----------+
| 10000000 |
+----------+
1 row in set (0.76 sec)

mysql> select @@tidb_partition_prune_mode;
+-----------------------------+
| @@tidb_partition_prune_mode |
+-----------------------------+
| dynamic                     |
+-----------------------------+
1 row in set (0.00 sec)

mysql> analyze table sbtest1 partition p1,p2,p3,p4,p5;
Query OK, 0 rows affected, 5 warnings (10.82 sec)

mysql> set @@tidb_partition_prune_mode = 'static';
Query OK, 0 rows affected (0.00 sec)

mysql> select @@tidb_partition_prune_mode;
+-----------------------------+
| @@tidb_partition_prune_mode |
+-----------------------------+
| static                      |
+-----------------------------+
1 row in set (0.00 sec)

mysql> analyze table sbtest1 partition p1,p2,p3,p4,p5;
Query OK, 0 rows affected, 5 warnings (7.03 sec)
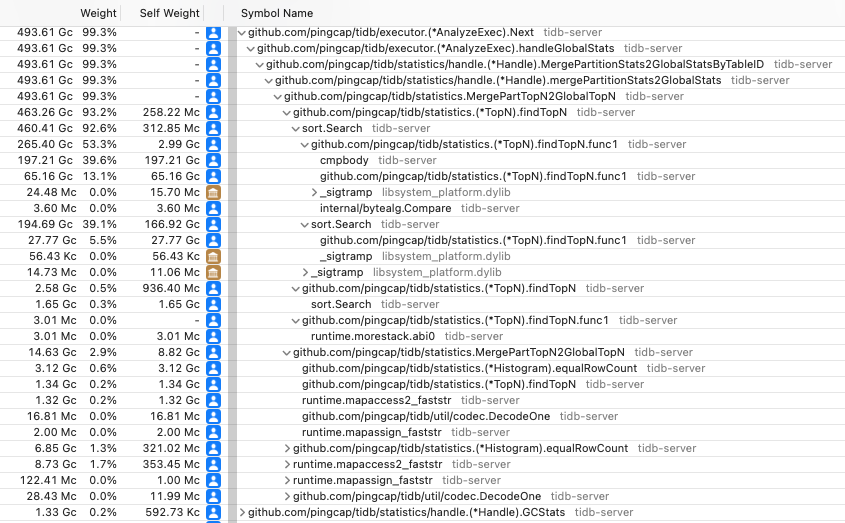
@Yisaer, I don't think this is fixed, I just tried to run an ANALYZE TABLE pt4096 on a similar table with ~1M rows with 4096 hash partitions, and it takes a very long time (analyzing the partitions seems to just be linear to number of partitions and was probably finished within a few minutes, but the aggregation to global stats takes very long time).
Also I tried to kill the session (by ctrl-c on the mysql-client) but the analyze statement just continues, also SHOW ANALYZE STATUS only gives the last 30 partitions and no indication of the merge to global stats. How can I see the status or find the job-id to kill during this process?
And this is with a fresh build of current master (Git Commit Hash: e9044749c70b56e8436368c2766a989ae78db1de).
@Yisaer Can you help confirm with @mjonss if this issue can be closed since we have the analyze performance improved for partition table?
Hi, @mjonss I tested this case by sysbench with 1 table, 1000000 rows, 1024 partitions on analyzing table which costs 35mins. I found that if the partition tables increased, the time costed on merging stats for global stats will also be increased.
We revised this processing in: https://github.com/pingcap/tidb/pull/38358 https://github.com/pingcap/tidb/pull/38239 to solve this problem by merging partition stats and load partition stats in concurrency.
In our latest test, with 8 read partition stats concurrency and 16 merging partition concurrency, cost 5mins to analyze the table with 1024 partitions and cost 9min30s to analyze the table with 2048 partitions.
Thus I think the problem is solved and can be closed for now, feel free to reopen or comment if you have any questions.