tidb-dashboard
 tidb-dashboard copied to clipboard
开启DM增量同步后tidb-server内存使用率高不回收
Bug Report
Please answer these questions before submitting your issue. Thanks! 数据库中共有1万多张表,每张表有400个列。开启DM增量同步后tidb-server 内存使用率很高并且不回收内存,有OOM的风险,之前有过oom的经历。
解决办法:关闭dashboard的key-visualizer功能后内存使用恢复正常 https://docs.pingcap.com/zh/tidb/stable/dashboard-key-visualizer 开启DM增量同步后 What did you do? 数据库中共有1万多张表,每张表有400个列。 开启DM增量同步后,DM写入的tidb-server 内存使用率很高并且不回收内存。 
What did you expect to see? 希望看到内存使用率正常
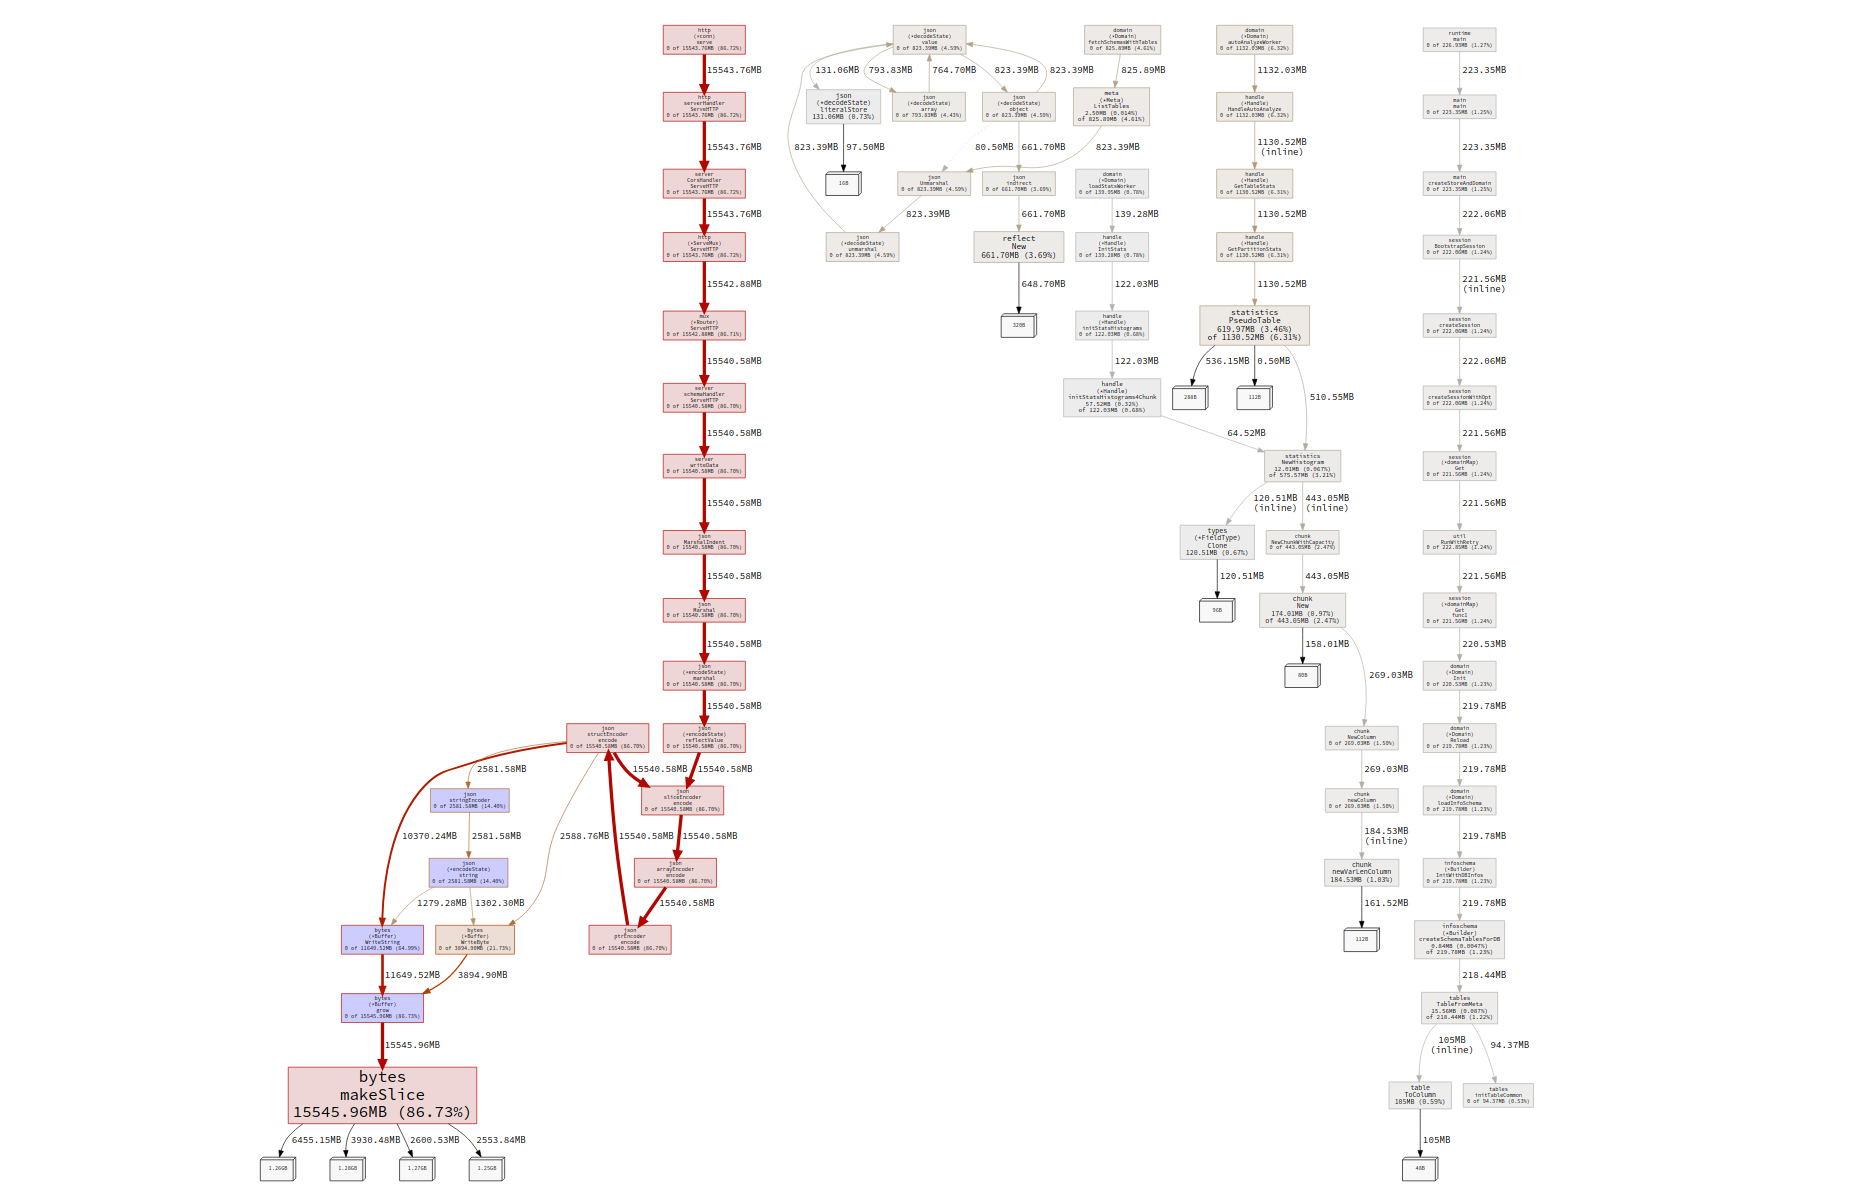
What did you see instead? 从内存的debug中,可以看到主要消耗在了解析 json 上,是通过一个 http 接口操作。
What version of TiDB Dashboard are you using (./tidb-dashboard --version)?
version --- v5.2.3
Thanks for the report! KeyVisualizer will request TiDB schema in a fixed interval, while TiDB will use too much memory when generating the schema json. Currently this memory usage is by design, since it is directly related with how many tables and columns are there in the TiDB and the memory usage will not keep increasing. @bb7133 Maybe outputting JSON in a streaming way can help?