flask_prometheus_metrics
 flask_prometheus_metrics copied to clipboard
Prometheus Metrics for Flask Web App
Flask Prometheus Metrics

![]()
Prometheus metrics exporter for Flask web applications.
flask_prometheus_metrics uses official Prometheus Python Client
providing basic metrics about process resource usage, app's requests metrics and information.
Installation
pip install -U flask_prometheus_metrics
You will need Flask to run examples below:
pip install -U 'flask_prometheus_metrics[flask]'
Usage
Run the following minimal example in Python shell:
from flask import Flask
from prometheus_client import make_wsgi_app
from werkzeug.middleware.dispatcher import DispatcherMiddleware
from werkzeug.serving import run_simple
from flask_prometheus_metrics import register_metrics

app = Flask(__name__)

@app.route("/")
def index():
    return "Test"

# provide app's version and deploy environment/config name to set a gauge metric
register_metrics(app, app_version="v0.1.2", app_config="staging")

# Plug metrics WSGI app to your main app with dispatcher
dispatcher = DispatcherMiddleware(app.wsgi_app, {"/metrics": make_wsgi_app()})

run_simple(hostname="localhost", port=5000, application=dispatcher)
Then go over http://localhost:5000/, refresh page a few times and check your
app's metrics at http://localhost:5000/metrics.
See also example.py for more elaborate example of library usage in real Flask applications.
Metrics
flask_prometheus_metrics exposes the following application metrics:
-
app_request_latency_seconds(histogram) - Application request latency -
app_request_count_total(counter) - application request count -
app_version_info(gauge) - application version
Library also provides some metrics about a Python interpreter used and process resource usage:
-
python_gc_objects_collected_total(counter) - objects collected during gc -
python_gc_objects_uncollectable_total(counter) - uncollectable object found during GC -
python_gc_collections_total(counter) - number of times this generation was collected -
python_info(gauge) - Python platform information -
process_virtual_memory_bytes(gauge) - virtual memory size in bytes -
process_resident_memory_bytes(gauge) - resident memory size in bytes -
process_start_time_seconds(gauge) - start time of the process since unix epoch in seconds -
process_cpu_seconds_total(counter) - total user and system CPU time spent in seconds -
process_open_fds(gauge) - number of open file descriptors -
process_max_fds(gauge) - maximum number of open file descriptors
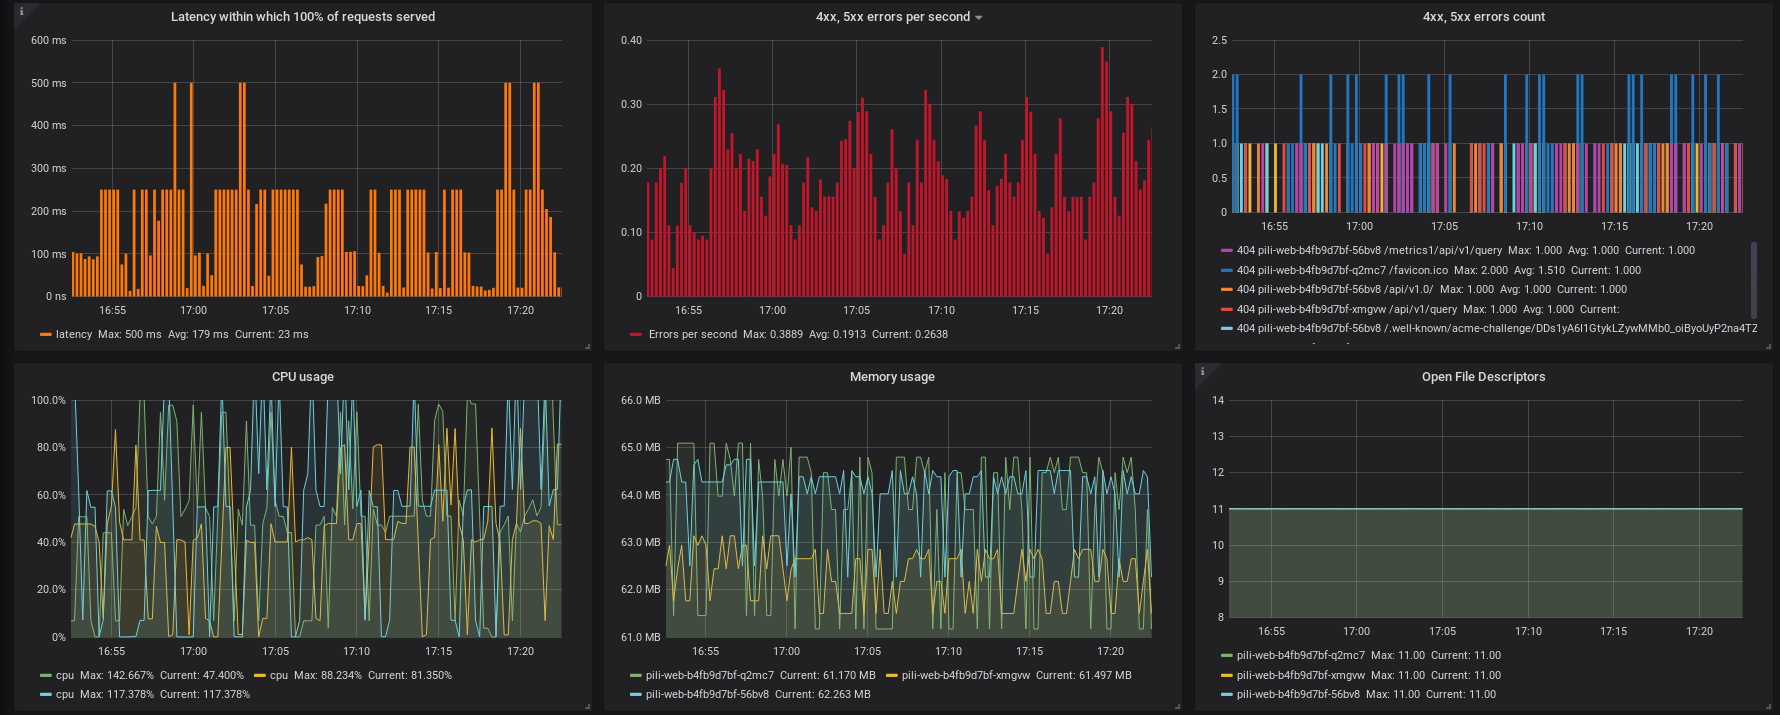
Grafana dashboard
The metrics exported by flask_prometheus_metrics can be scraped by
Prometheus monitoring system and then visualized in
Grafana.
You can download Grafana dashboard crafted specifically for the flask_prometheus_metrics
default metrics here.
Testing
When testing Flask application with DispatcherMiddleware (see Usage example above)
you may want to use a little hack
in order to make Flask's test_client() work properly.