Historical repeat OHLC levels not drawn correctly..
I'm not entirely sure what code is the cause of this but I'll demonstrate the issue through pics.
When a market trades completely sideways it's convention to draw a flat horizontal line until a new clearing price change occurs. So it should look like this:
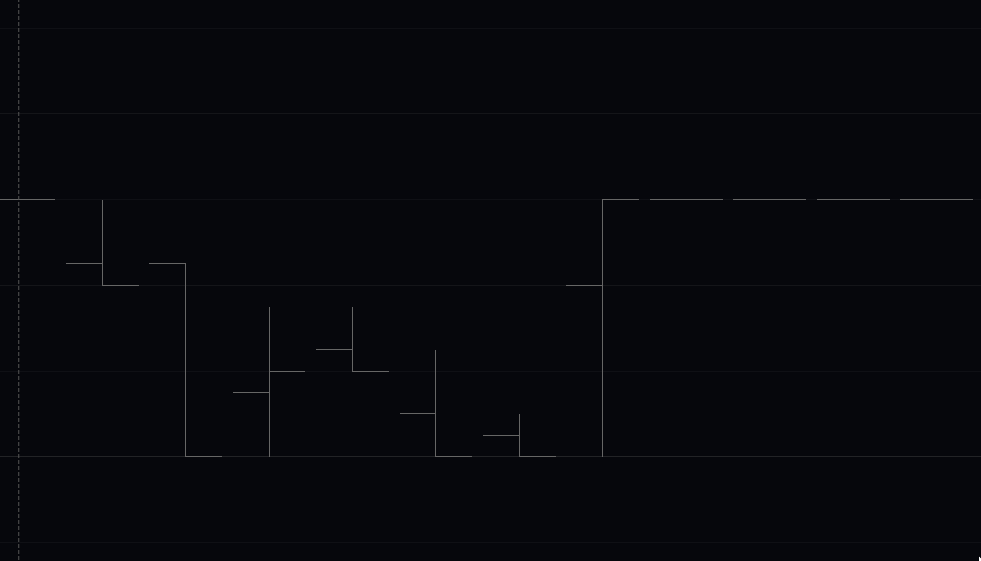
In this case this was a futures session close so our chart was just left idle-incrementing - so this is an extreme sideways case :joy:, but you get the idea.
What it's looking like when we load such history from storage in most cases is like this:
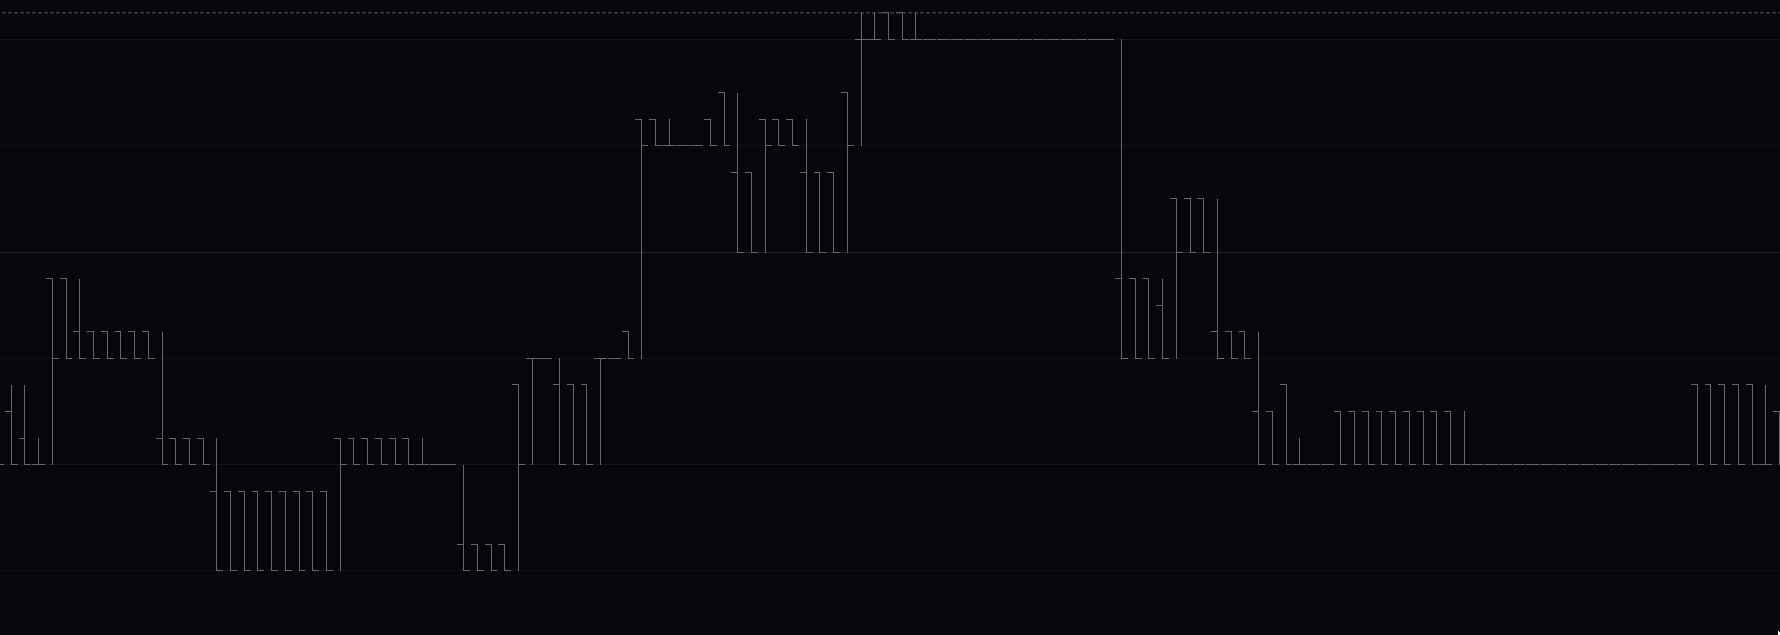
So instead of a bar shape and then a bunch of flat bars on the last close level, we get these weird copies of the original bar. The way you can additionally tell this isn't correct is by looking at volume where you'll only see vlm on the first non-flat bar print:
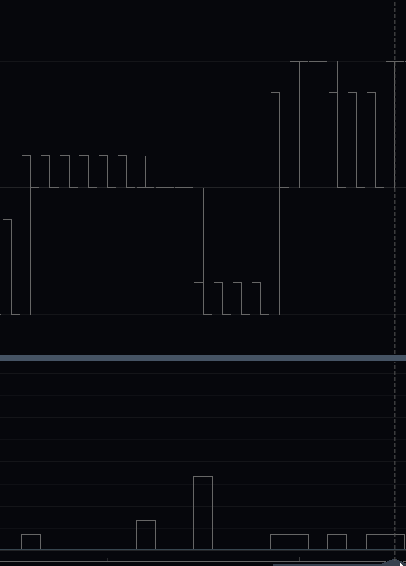
I've scoured our ohlc sampling code but can't see how we'd be doing this by accident, and further you never see this issues on a live running chart, it only seem to be when we load such data from storage.
This leads me to suspect one of the following:
-
marketstoreis somehow got an issue where it's writing the flat, non-vlm datums incorrectly - when we read from
marketstoreour code is somehow converting things wrong?- since we use our
anyio-marketstoreclient for this query I would guess the issue would have to be in thedecode()utility? (more precisely thenp.from_buffer()call?).
- since we use our