Roadmap
This issue is to discuss the finer details of the GSOC project. In my mind Sputnik can be divided in several components:
Launching the app
The basic is a function Sputnik.launch to launch the app. I see at least three methods:
-
Sputnik.launch(t::AbstractIndexedTable)which will start on the given table -
Sputnik.launch(t::AbstractString)which will callloadtableon the string -
Sputnik.launch()which should open a file dialogue.
We can discuss whether we want to somehow cache tables used in the past to have them available to reload on the GUI (potentially a time saver for users)
Data selection and grouping
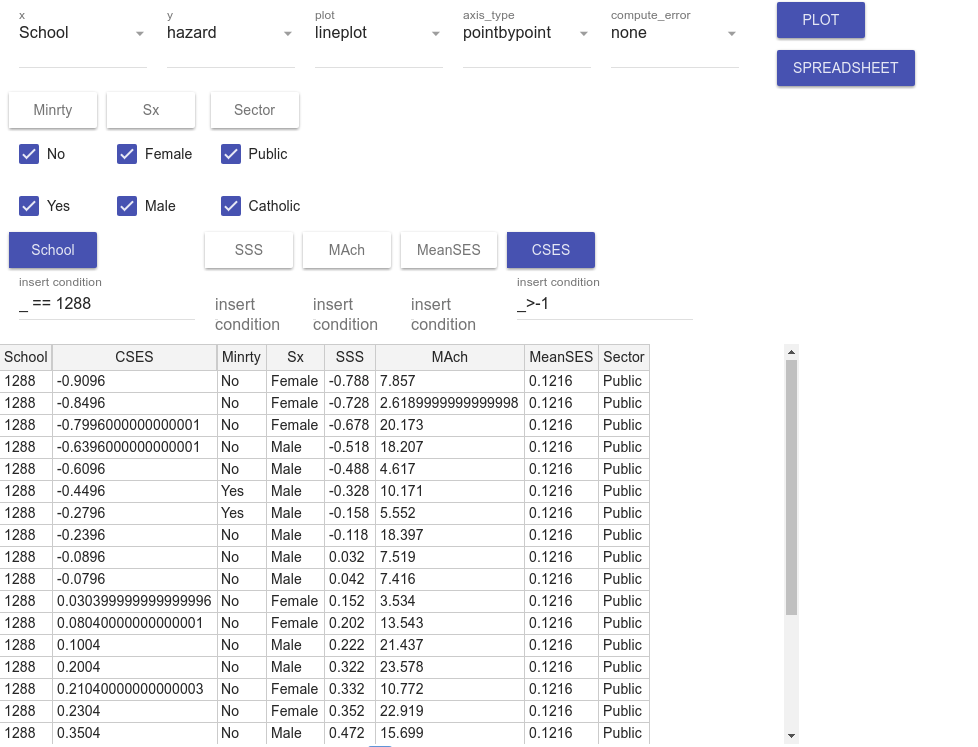
This is a part where I'd like to build on the PlugAndPlot strategy. For each column I would have a togglebutton (if toggled, it means the column becomes a primary key) and also:
- if the column has
< ndistinct values (wherenis user defined with some default), simply display a set of checkboxes to tick the accepted values (all are ticked by default) - if the column has
>= ndistinct values display a checkbox where the user can explicitly type a condition to select data (we should probably allow the_syntax for that, i.e,3 < _ < 10)
See here to see how it was with PlugAndPlot.
Visualizations
The most basic visualization should be TableView.showtable to visualize the table as a spreadsheet. showtable(t) |> dom"div" can easily be imbedded in the app, so this should pose no problems, here we should only show rows selected above and the toggled columns should be primary.
Then I'd like to also support statistical recipes from StatPlots, population analysis plots from GroupedErrors (+ align and average style of plots from GroupedErrors+ShiftedArrays) as well as OnlineStats recipes. The framework should be easy to extend (more in next session).
Interface with visualization packages
This is the tricky bit, how to have various visualization packages interact nicely with Sputnik. My initial idea is to define some sort of "visualization interface" in a low dependencies package (tentatively called SputnikUtilities) which would define a type Visualization that stores all the information required to generate a visualization and then have packages depend on it to define how to process the visualization (alternative, esp. at the beginning, the whole thing could live in SputnikUtilities using Requires to cut down dependencies).
On Sputnik side, there should be a way to create a Visualization from the table and the selected widgets. It may also be interesting to develop a mechanism that, according to what visualization package was selected, removes all widgets that are unnecessary for that package.
CC: the mentors @shashi and @ChrisRackauckas