physiozoo
 physiozoo copied to clipboard
Peaks annotated as signal quality C are still used for computations
I am in the process of setting myself up to analyze some existing ECG data. First i want to enhance the preprocessed data by manually correcting some faulty peak detections and marking material with poor signal quality to be excluded from computations. PhysioZoo can be used for this very easily and intuitively. As I was loading my data (peak file) in the HRV module I realized that all the computated values stayed the same before and after loading the quality file which led me to further inspect this behavior.
It seems that the quality file only affects the display of the data but none of the computations. I expected that data annotated with signal quality c is not used for computation, that either some correction algorithms are used, if suitable, or n.a. is returned.
To test this I first created some test data using Python and Neurokit2 (sorry for not using MATLAB):
import neurokit2 as nk
import numpy as np

ecg75 = nk.ecg_simulate(duration=3600, noise=0, heart_rate=75, sampling_rate=1024)
np.savetxt('/tmp/ecgsim75bpm_1024hz_3600s.txt', ecg75, fmt='%-10.10g')
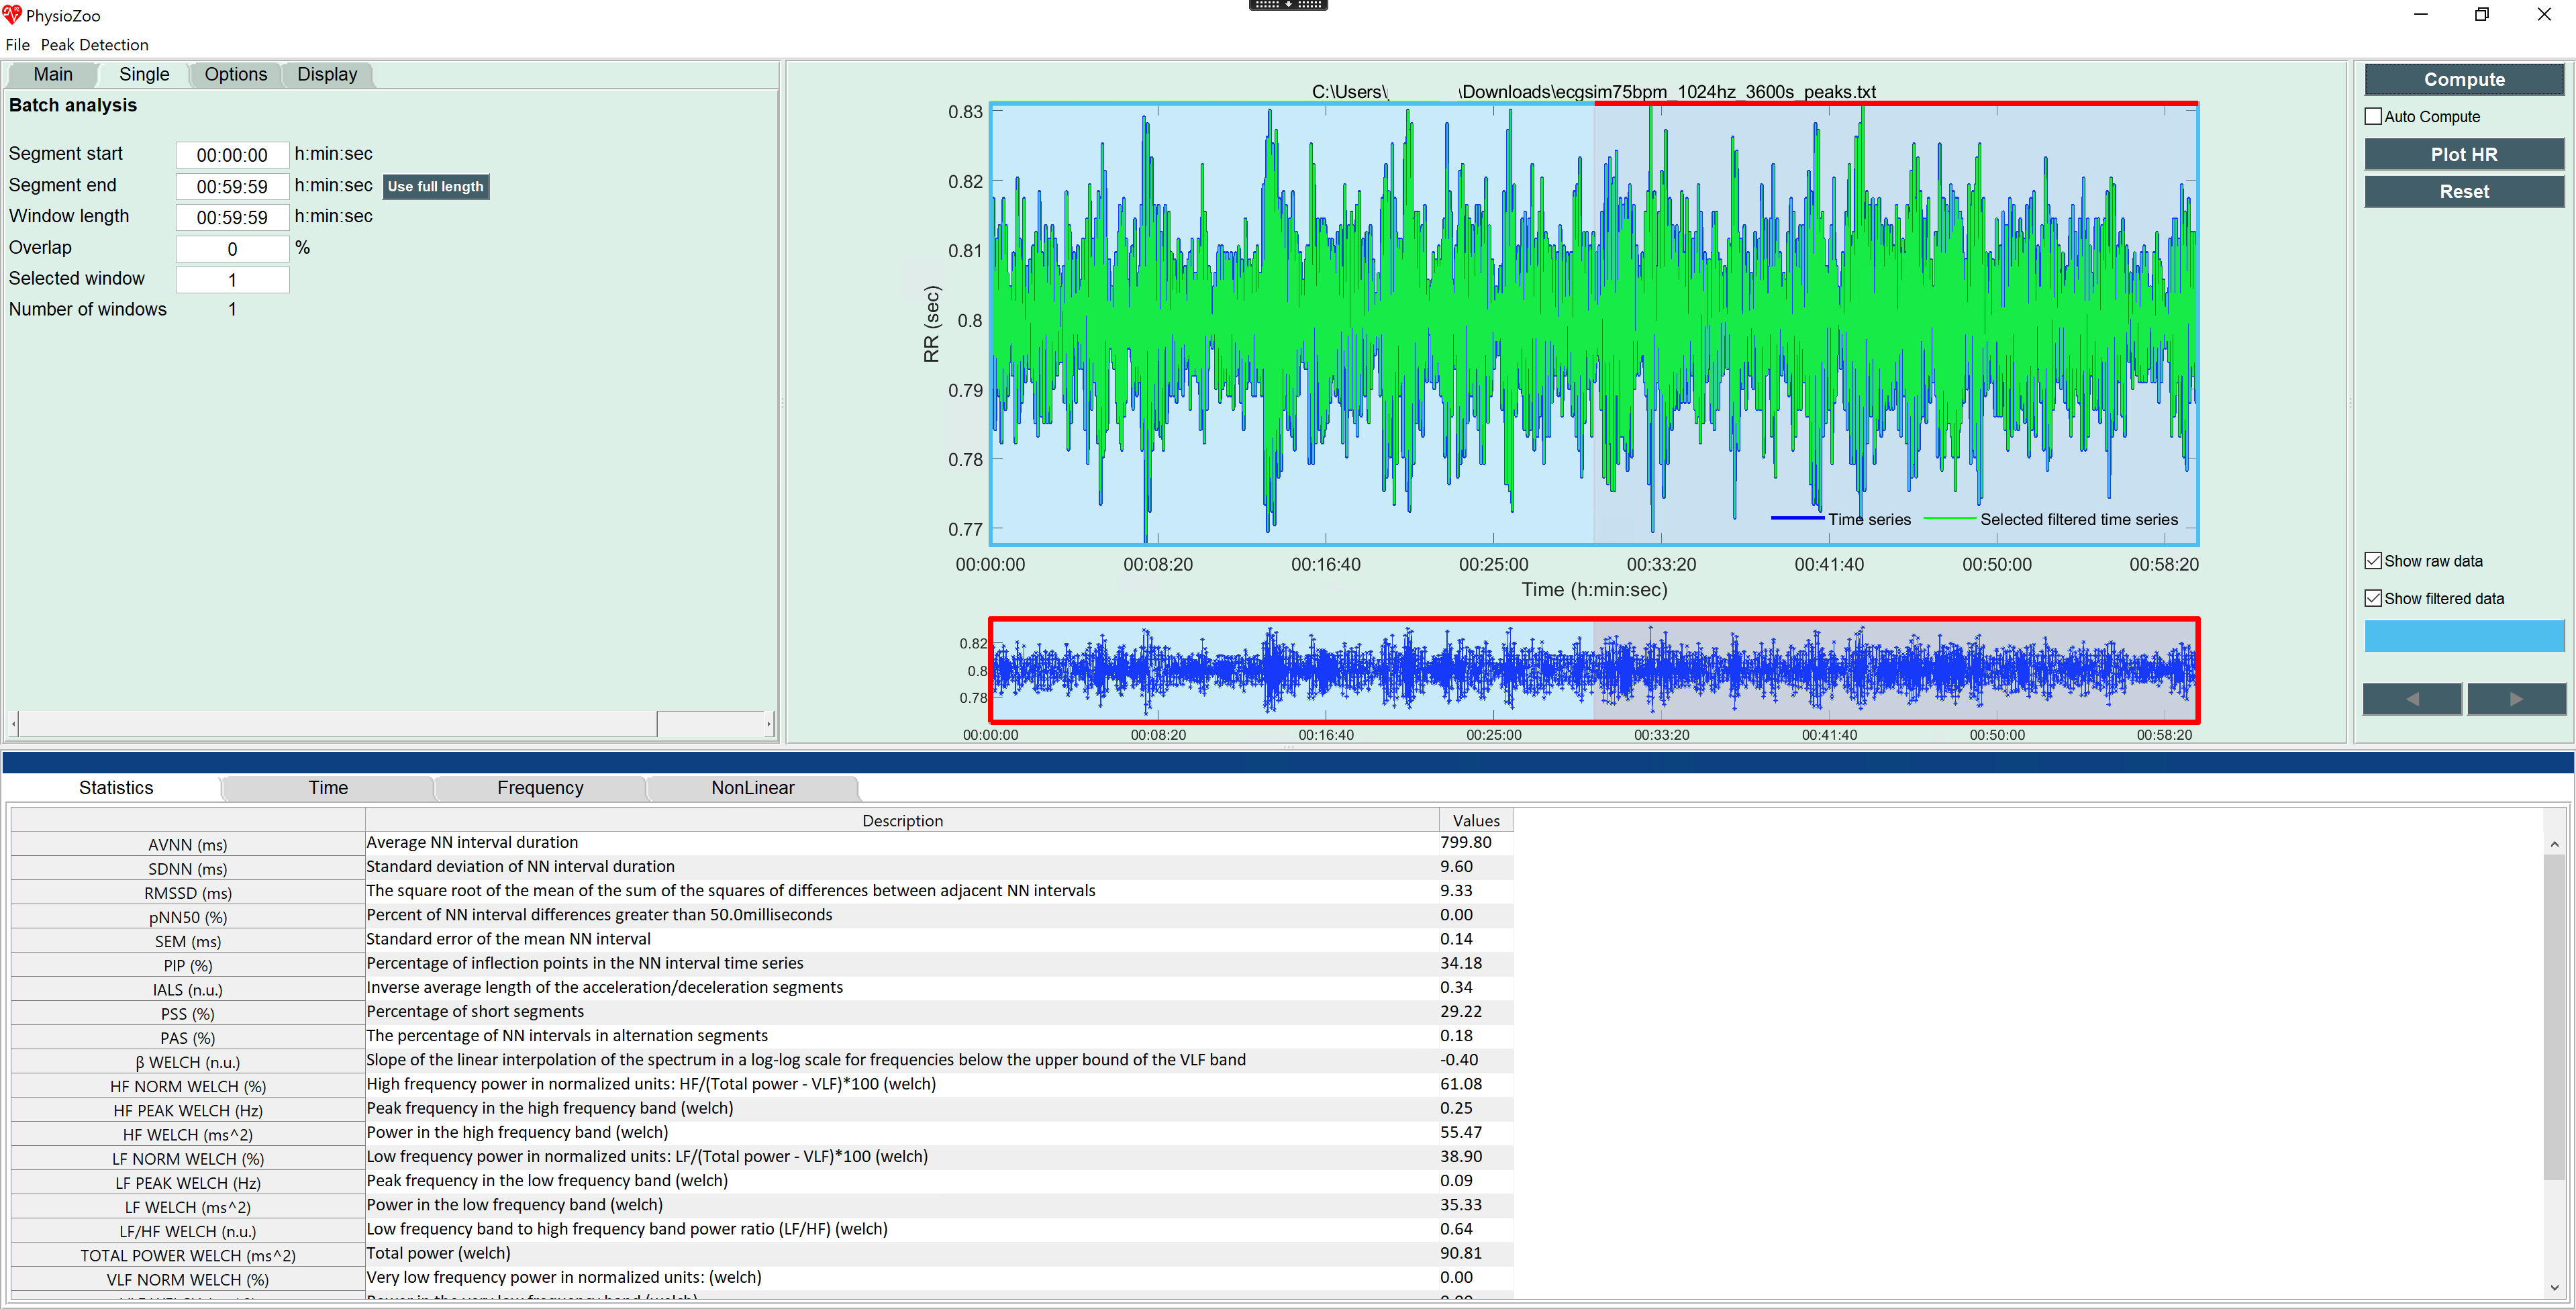
I loaded the file into PhysioZoo, ran a peak detection which ran perfectly as the simulated data contains no noise. I annotated the second half of the data as signal quality C (Neither HRV or morphological analysis is possible). I saved the peaks and the quality file and switched to the HRV module. First I loaded the peaks and ran a one window analysis using the whole data (it should be an hour but it is shown with a length of 0:59:59) resulting in an AVNN of 799.80 for this simulated data set (see image1.png). Now I loaded the the signal quality file and triggered a new computation but all results remained unchanged (see image2.png).
---
type: quality annotation
source file: ecgsim75bpm_1024hz_3600s.txt

---

Beginning       End             Class
1800.000000     3600.000000     C
I then used the whole file length and defined two non-overlapping windows of 0:29:59 and computed results. I expected that only the first window would be computed as the second half is fully annotated as signal quality C. Despite that the computations were done on both windows seemingly ignoring the annotations. Nevertheless the results are helpful as they show that the AVNN for the first half of the data is 799.82 and 799.78 for the second half (see image3.png). The data is simulated but has enough variance for testing.
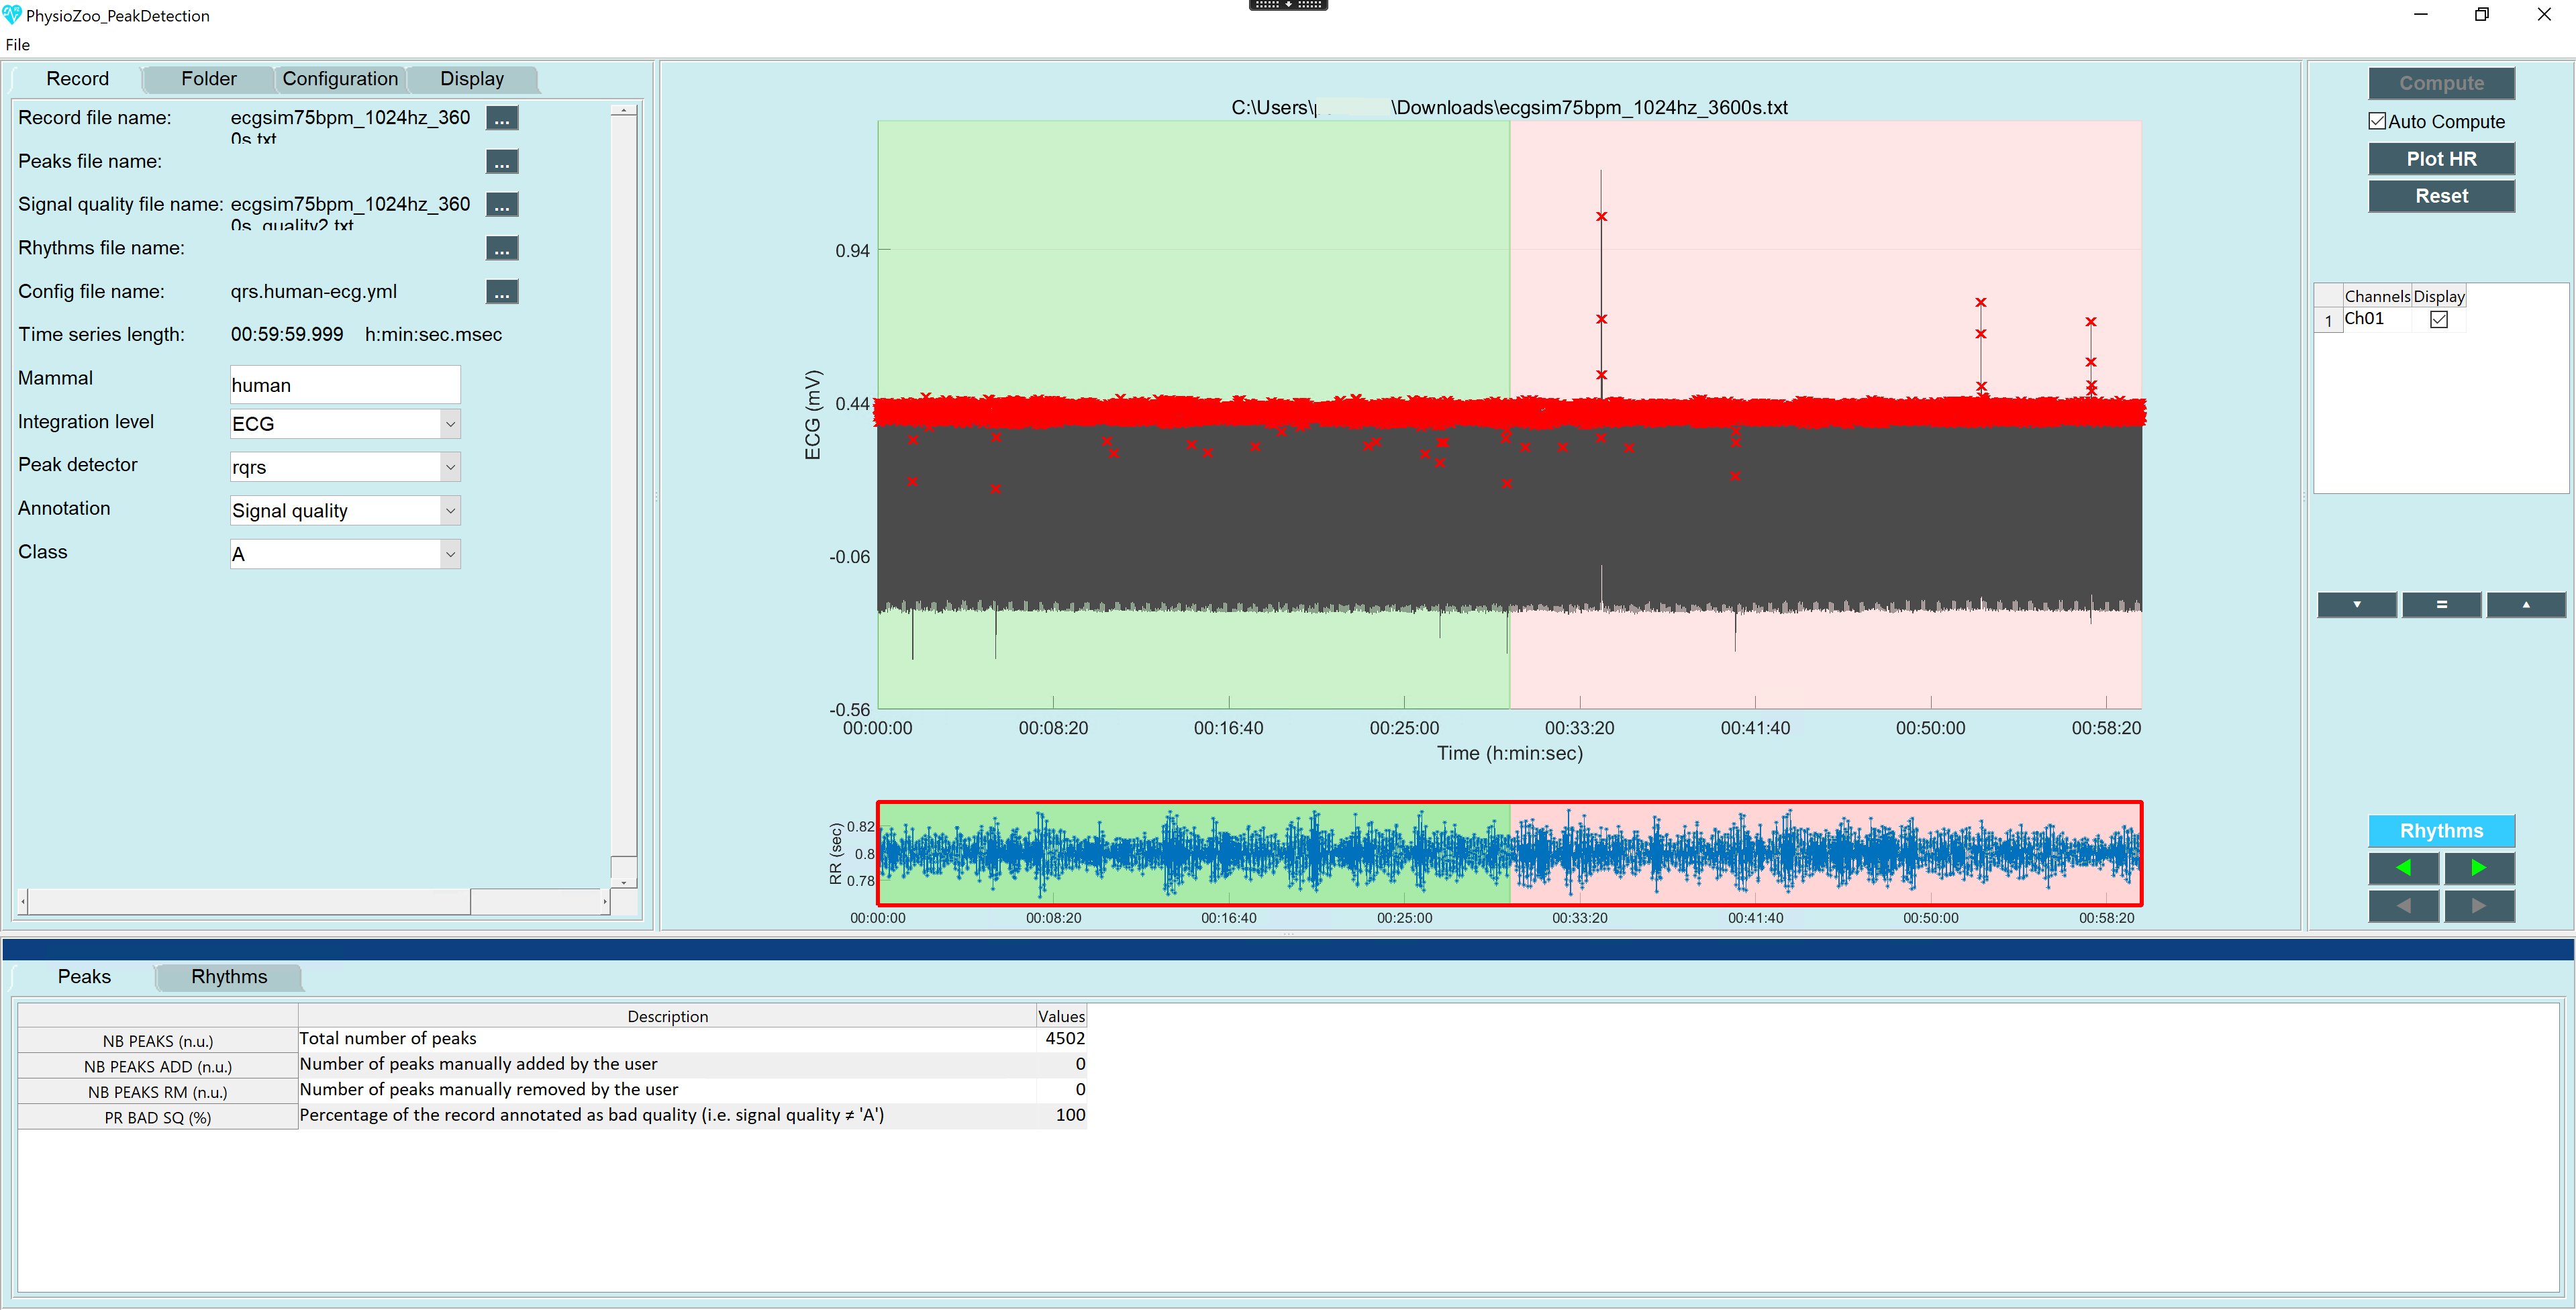
To test whether annotations are only used when being used on the full data set I declared the first half as signal quality A. When loading this file in the peak detection module the background for the first half of the data is green and the second half has a red background (see image 4). Interessingly the value for "PR bad SQ" first displays 50 for a very short time and then jumps to 100. Switching back to the first file only annotating the second half as C increases "PR bad SQ" to 150, probably similar to issue #15.
---
type: quality annotation
source file: ecgsim75bpm_1024hz_3600s.txt

---

Beginning	End		Class
0.000000	1799.999999	A
1800.000000	3600.000000	C
Loading the file into the HRV module has no effect on the computations, but the whole status bar reflecting data quality is now totally red instead of a green bar for the first half and red for the second half of the data .
Can you please tell whether I proceeded wrongly (and how to proceed properly) or if this is the expected behavior.
I am using (primarly) PhysioZoo Standalone on Windows. I downloaded the 1.5.7-Installer but the installation states version 1.5.5. I replicated all results shown in this issue using MATLAB R2020b Update 3 for Windows using the 1.5.7 source code.