Passenger server machine high load average each ~2 hours
Issue report
Hello,
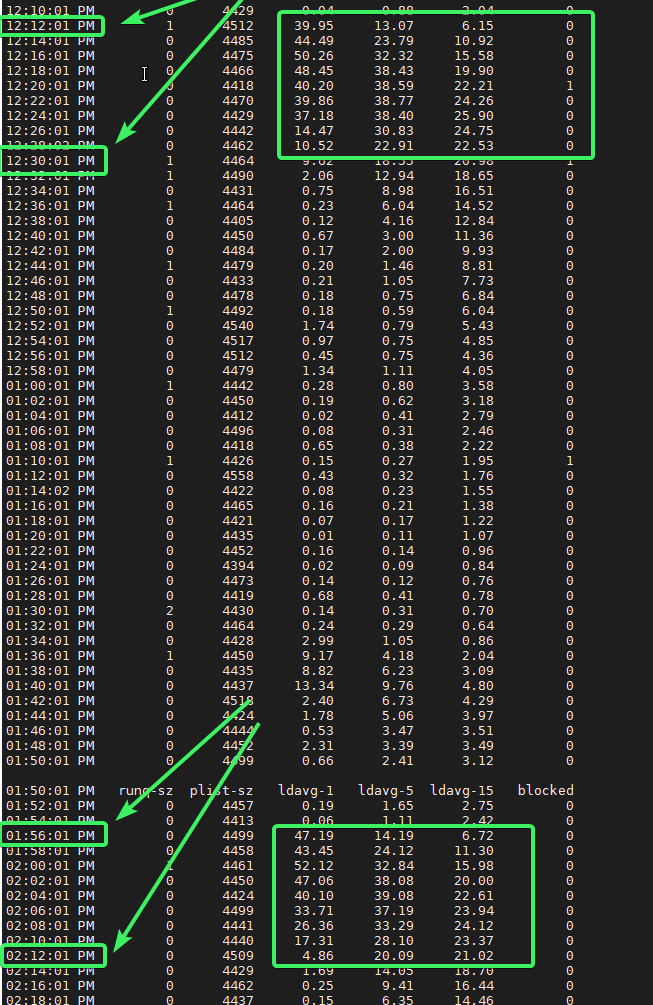
We're having a strange behaviour in our passenger servers. Each almost two hours every day the load average of the machine increase a lot during ~10m and then go stable again. The strange thing here is that the CPU still stable during the high load.
Load Average - Example
12:18:01 PM         0      3693      0.03      0.05      0.15         0
12:20:01 PM         0      3698      0.17      0.07      0.14         0
12:22:01 PM         0      3682      0.06      0.06      0.12         0
12:24:01 PM         0      3693     38.34     16.06      6.10         0
12:26:01 PM         0      3691     37.84     23.35      9.99         0
12:28:01 PM         0      3689     33.06     26.64     12.84         1
12:30:01 PM         2      3715     22.78     25.40     14.10         0
12:32:01 PM         0      3688     12.33     21.03     13.90         0
12:34:01 PM         1      3723      2.96     14.84     12.52         0
12:36:01 PM         1      3755      1.75     10.35     11.14         0
12:38:01 PM         0      3711      0.62      7.15      9.87         0
12:40:01 PM         0      3756      0.22      4.82      8.69         0
12:42:01 PM         0      3706      0.04      3.23      7.63         0
CPU same time - Example
12:16:01 PM     CPU     %user     %nice   %system   %iowait    %steal     %idle
12:18:01 PM     all      2.93      1.82      7.21      0.14      0.00     87.90
12:20:01 PM     all      3.36      1.89      7.59      0.20      0.00     86.97
12:22:01 PM     all      3.09      1.79      7.41      0.19      0.00     87.53
12:24:01 PM     all      2.95      1.92      7.41      0.18      0.00     87.53
12:26:01 PM     all      3.42      1.89      7.49      0.20      0.00     87.00
12:28:01 PM     all      2.91      1.87      7.32      0.17      0.00     87.73
12:30:01 PM     all      5.94      1.84      9.04      0.26      0.00     82.91
12:32:01 PM     all     10.55      1.90     12.25      0.41      0.00     74.89
12:34:01 PM     all     12.82      1.89     11.26      0.32      0.00     73.70
12:36:01 PM     all      8.05      1.90     10.64      0.39      0.00     79.02
12:38:01 PM     all      8.76      1.92      9.46      0.21      0.00     79.66
12:40:01 PM     all      3.77      1.86      7.78      0.19      0.00     86.40
12:42:01 PM     all      3.23      1.93      7.50      0.43      0.00     86.91
In those severs we have some passenger instances and Nginx server.
SO version SLES 12 SP4
Question 4: Passenger installation method: Your answer: [ ] RubyGems + Gemfile [X ] RubyGems, no Gemfile [ ] Phusion APT repo [ ] Phusion YUM repo [ ] OS X Homebrew [ ] source tarball [ ] Other, please specify:
Question 5: Your app's programming language (including any version managers) and framework (including versions): Passenger Enterprise 5.0.30 Rails 5.2.2 Ruby 2.3.7p456 Node v10.16.0
Question 6: Are you using a PaaS and/or containerization? If so which one?
- For example: Heroku, Amazon Container Services, Docker 1.9 with an image based on passenger-docker On-premise ESXi VMWare
I'll need more info to help with this, for example your passenger config would be a good starting place.
This is an example for one of the instances:
<%= include_passenger_internal_template('global.erb') %>
worker_processes 1; events { worker_connections 4096; }
http { <%= include_passenger_internal_template('http.erb', 4) %>
### BEGIN your own configuration options ###
# This is a good place to put your own config
# options. Note that your options must not
# conflict with the ones Passenger already sets.
# Learn more at:
# https://www.phusionpassenger.com/library/config/standalone/intro.html#nginx-configuration-template

### END your own configuration options ###

default_type application/octet-stream;
types_hash_max_size 2048;
server_names_hash_bucket_size 64;
client_max_body_size 1024m;
access_log off;
keepalive_timeout 60;
underscores_in_headers on;
gzip on;
gzip_comp_level 3;
gzip_min_length 150;
gzip_proxied any;
gzip_types text/plain text/css text/json text/javascript
    application/javascript application/x-javascript application/json
    application/rss+xml application/vnd.ms-fontobject application/x-font-ttf
    application/xml font/opentype image/svg+xml text/xml;

<% if @app_finder.multi_mode? %>
    # Default server entry for mass deployment mode.
    server {
        <%= include_passenger_internal_template('mass_deployment_default_server.erb', 12) %>
    }
<% end %>

<% for app in @apps %>
server {
    <%= include_passenger_internal_template('server.erb', 8, true, binding) %>
    <%= include_passenger_internal_template('rails_asset_pipeline.erb', 8, false) %>

    ### BEGIN your own configuration options ###
    # This is a good place to put your own config
    # options. Note that your options must not
    # conflict with the ones Passenger already sets.
    # Learn more at:
    # https://www.phusionpassenger.com/library/config/standalone/intro.html#nginx-configuration-template
    passenger_base_uri /<%= app[:envvars]['gcc_name'] %>;
    ### END your own configuration options ###
}
passenger_pre_start http://<%= listen_url(app) %>:/<%= app[:envvars]['gcc_name'] %>;
<% end %>

<%= include_passenger_internal_template('footer.erb', 4) %>
} min_instances: 2 max_pool_size: 2 thread_count: 4 max_ram: 1024
Hi, we don't use out of band gc. We see this behavior on different stack:
- with an old Passenger 5.0.30 Enterprise
- with the most recent one Passenger 6.0.6 Enterprise
We have on the same server started with systemd 60 Passenger instance. We see that around every 2 hours the CPU's server is overload (peak) but we don't see any activity. We use NewRelic to monitor and their is no additional 'transactions' outside this peak.
every on average 1:40 hour the load start. We stop all except Passenger (no cron, other apps running on this VM) If we stop Passenger (we have near 40 instances started on this VM each Passenger with 2 Processes and 4 threads each) the load is gone. Does something run in Core process of Passenger (check, cleaning, fork, ) that is not perceptible if 1 or 2 Passenger instance but with 40 instances started it seems "overload" ?
We have the same approach on Sidekiq with 40 instances and don't see the "pattern" of peak occuring.
And this happening on release Passenger Enterprise 5.0.30 and 6.0.6 !
Are you using this method of usage reporting: https://www.phusionpassenger.com/docs/advanced_guides/config_and_optimization/nginx/cloud_licensing_configuration.html
You could also try disabling telemetry: https://www.phusionpassenger.com/docs/advanced_guides/in_depth/ruby/anonymous_telemetry_reporting.html
Hi, @CamJN thanks for your reply. we don't use Passenger cloud. In 5.0.30 there is no cloud access so don't need to deactivate the telemetry as available only since release 6.x
And in the stack running Passenger Enterprise 6.X we have deactivate telemetry in config file : Passengerfile.json
"disable_security_update_check": "true", "disable_anonymous_telemetry":"true",
At this point, you'll have to attach a profiler to the process, as I cannot reproduce this and none of our periodic tasks seem to be in use in your setup.