blog_os
 blog_os copied to clipboard
Error on testing post-05 on Mac OS
When I run the breakpoint test for post-05 ("CPU Exceptions"), it never terminates. I ran into the issue when I was following along, and I verified on the version in this repo. It just loops over and over again until I stop it (with ctrl-c):
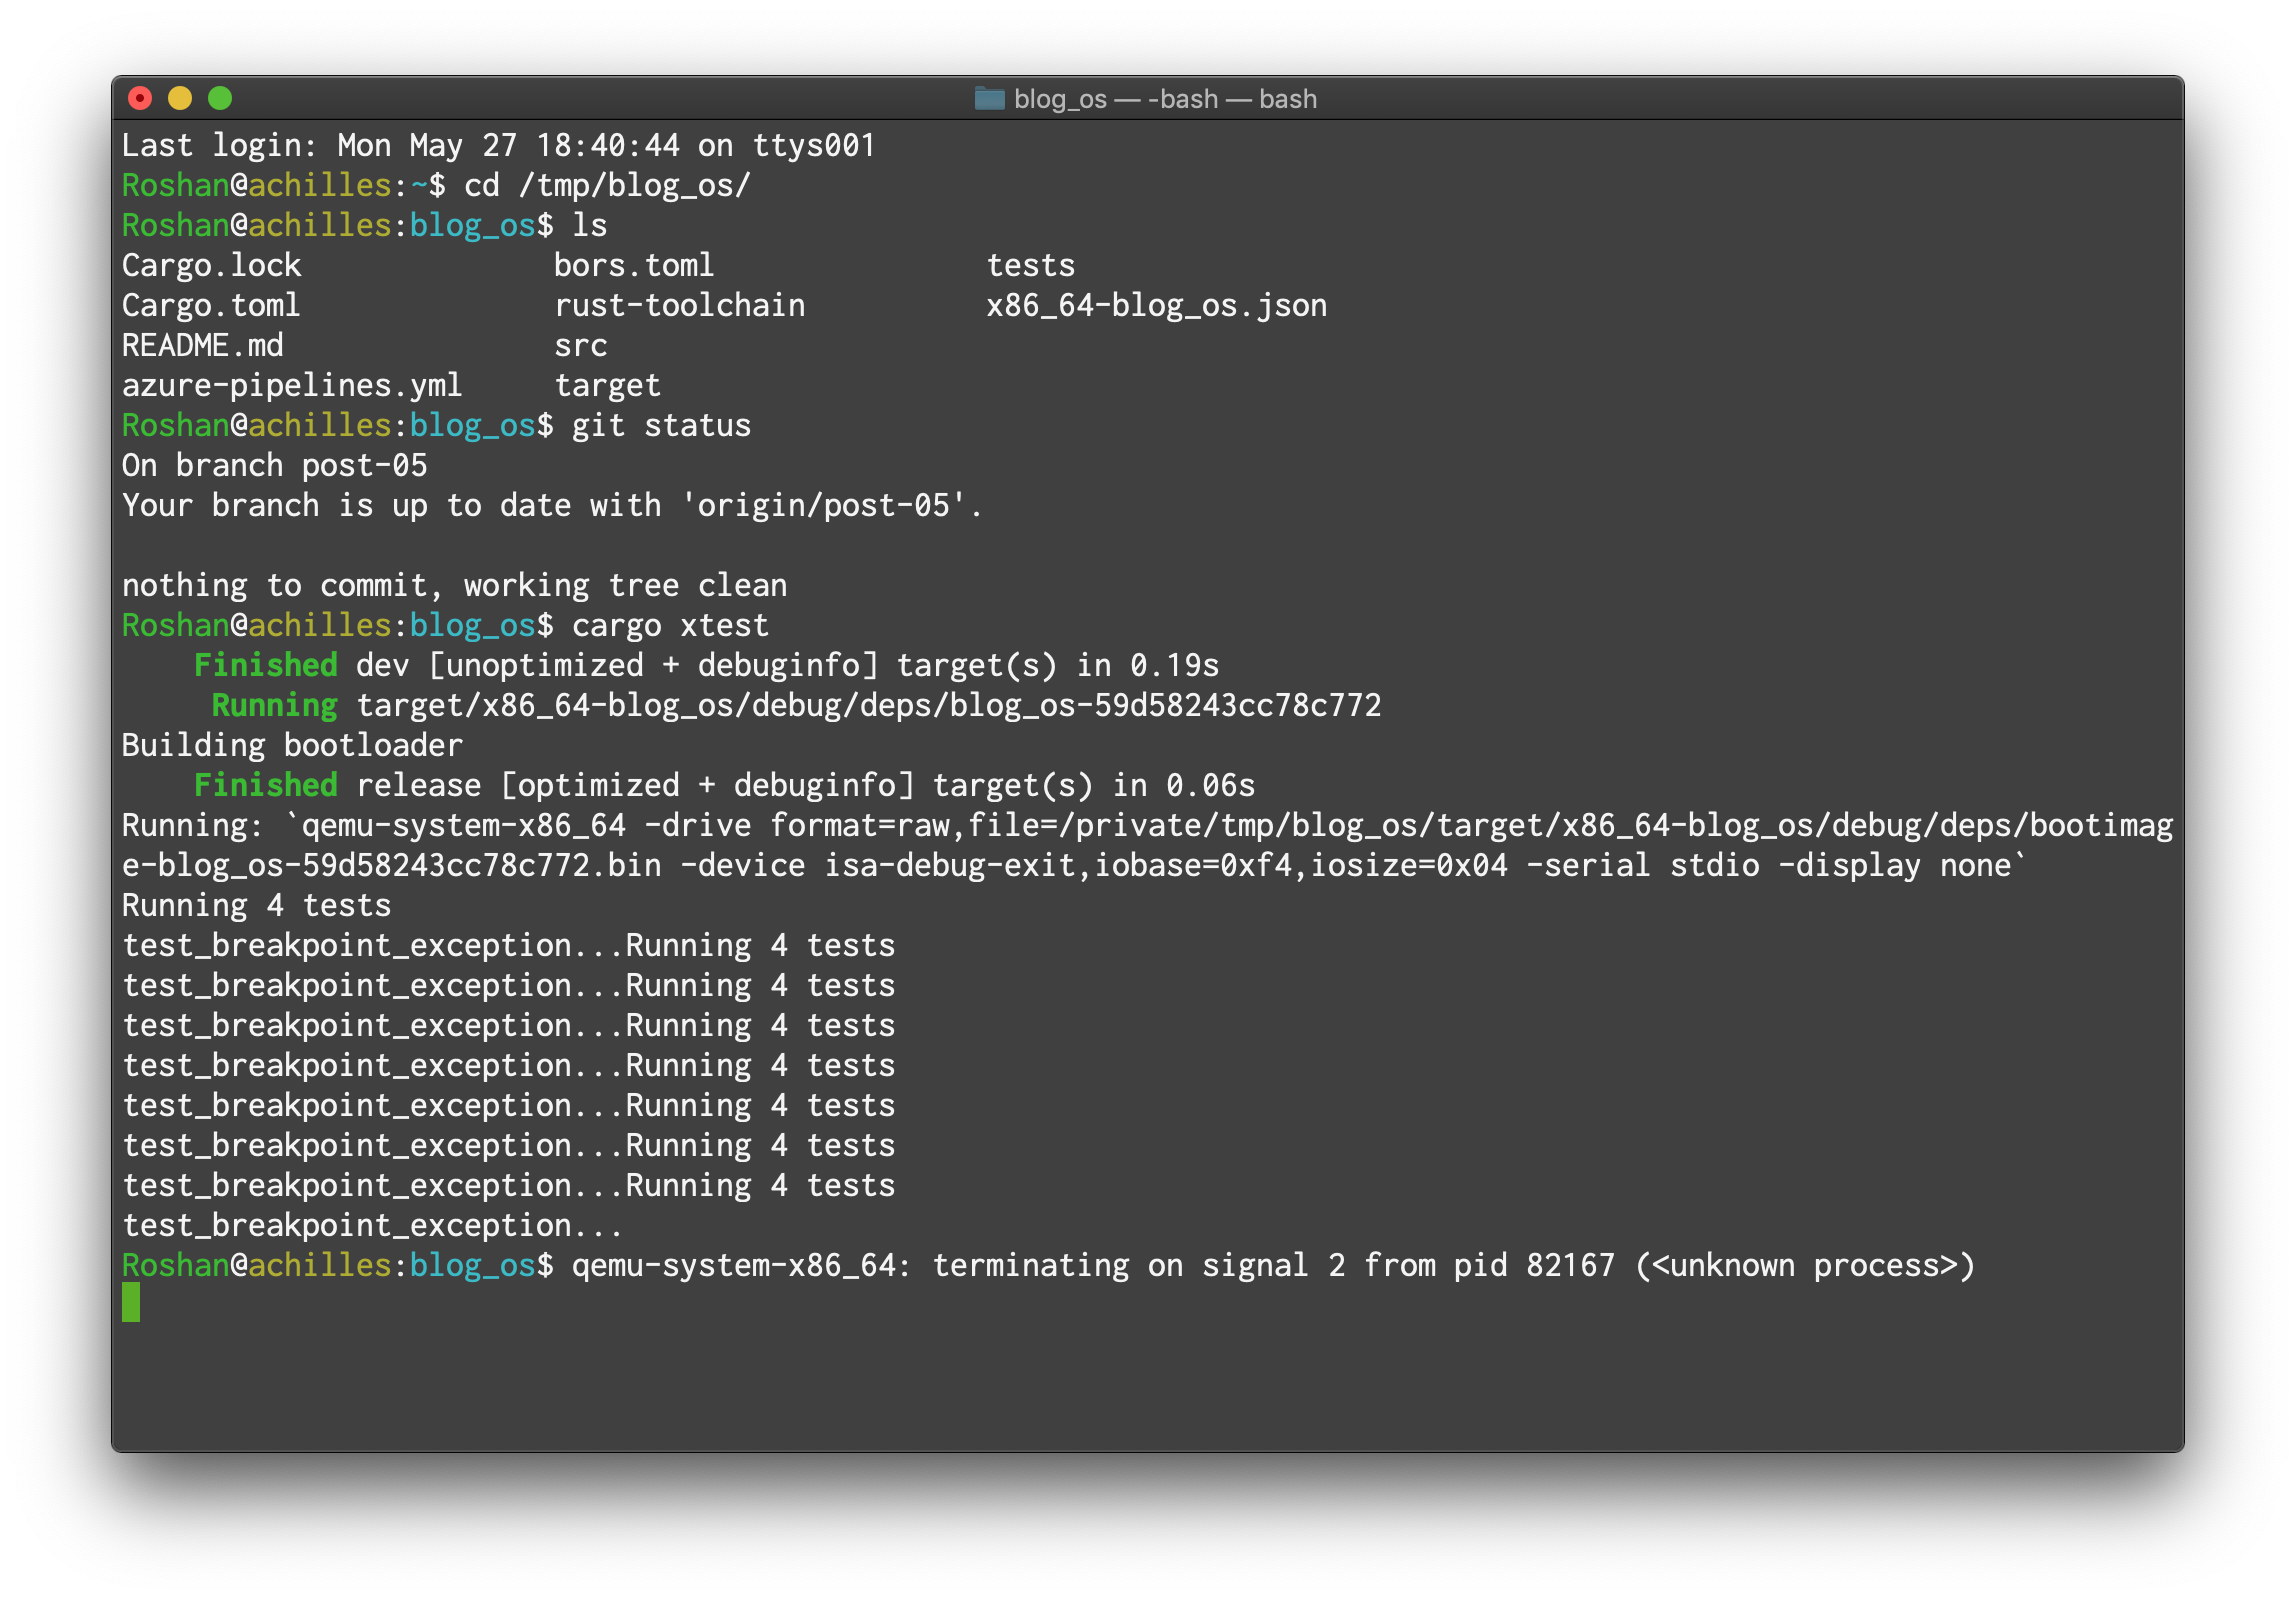
I'm running:
- macOS 10.14.5 (18F132)
- cargo 1.37.0-nightly (545f35425 2019-05-23)
- nightly-2019-05-22-x86_64-apple-darwin
- QEMU emulator version 4.0.0
When I run the same tests on Ubuntu 18.04, it passes.
Thanks for reporting! It seems like there is a problem when handling the breakpoint exception. Does the rest of the code from the post work for you? Do the other unit/integration tests work?
Could you try to remove the -display none from the bootimage test args on your Cargo.toml? Maybe this already shows what the problem is (probably not because it closes too fast). Otherwise, could you add the -d int and -no-reboot arguments to test-args? This should give you a log of all interrupts that occur in your console, which might help us to pinpoint this issue.
(Note that I'm writing this on mobile, so I'm not 100% sure about the argument names since I can't test it right now.)
I removed -display none, and I can see that the test just causes it to restart in a loop.
When I commented out the test, it successfully passed the lib tests, but then did the same thing (got stuck in a reboot loop) when "testing" main. When I commented out line 17 of main.rs:
// invoke a breakpoint exception
x86_64::instructions::interrupts::int3();
it successfully completed the main "test".
I ran test with the arguments you asked for (which were correct), and the terminal output is attached here.
Hope this helps!
Thanks a lot! The relevant part of the output is this:
    Finished dev [unoptimized + debuginfo] target(s) in 0.02s
     Running target/x86_64-blog_os/debug/deps/blog_os-ab19507107fcd35d
Building bootloader
    Finished release [optimized + debuginfo] target(s) in 0.02s
Running: `qemu-system-x86_64 -drive format=raw,file=/private/tmp/blog_os/target/x86_64-blog_os/debug/deps/bootimage-blog_os-ab19507107fcd35d.bin -device isa-debug-exit,iobase=0xf4,iosize=0x04 -serial stdio -d int -no-reboot`
[…]
Running 4 tests
test_breakpoint_exception...
     0: v=03 e=0000 i=1 cpl=0 IP=0008:000000000020a0d0 pc=000000000020a0d0
     […]
check_exception old: 0xffffffff new 0x6
     1: v=06 e=0000 i=0 cpl=0 IP=0008:000000000020c59c pc=000000000020c59c
     […]
check_exception old: 0xffffffff new 0xb
     2: v=0b e=0062 i=0 cpl=0 IP=0008:000000000020c59c pc=000000000020c59c
     […]
check_exception old: 0xb new 0xb
     3: v=08 e=0000 i=0 cpl=0 IP=0008:000000000020c59c pc=000000000020c59c
     […]
check_exception old: 0x8 new 0xb
error: test failed, to rerun pass '--lib'
The 0: v=03 line telss us that a breakpoint exception occured (exception number 3). Afterwards, the CPU jumps to the exception handler as we see from the changed instruction pointer (IP). The problem is now that an "invalid opcode" exception occurs when executing the breakpoint handler (the 1: v=06 line).
Next, the CPU tries to invoke the invalid opcode exception handler, but we didn't register any handler for that exception. Therefore, a "segment not present" exception occurs (the 2: v=0b line). Since we didn't register a handler for that exception either, another "segment not present" exception occurs, which is escalated to a "double fault" (see the next post). Finally, the CPU tries to invoke the double fault handler, but since we didn't register a handler function yet it causes a "triple fault" which the hardware handles by resetting the system.
So this is what happens. The question is why the invalid opcode exception happens in the first place. The best way to find this out is to look at the disassembly of the relevant code. Could you show me the disassembly of the code around address 0x20c59c (the value of the instruction pointer (IP) field where the invalid opcode exception occured)?
To get the disassembly you can use objdump and grep for the relevant line with a few lines of context:
objdump -d target/x86_64-blog_os/debug/blog_os -M intel | grep -C 50 20c59c
If you recompiled the project you might need to adjust the 20c59c number. Don't use a 0x prefix in the grep search because the disassembly prints the addresses without prefix.
If you don't have objdump and grep installed and are unsure how to install it, you can also do this with pure-rust tools:
$ cargo install cargo-binutils ripgrep
$ cargo objdump -- -d target/x86_64-blog_os/debug/blog_os -M intel | rg -C 50 20c59c
The output should tells us at which instruction the "invalid opcode" exception occured, so that we can investigate why it occurs.
Hey, sorry for the delay. I ran the command, but there is no instruction at 0x20c59c. The binary only goes to 0x20ab60. I'm not sure what causing that, or if there's a section of the binary not being output. I'm traveling this weekend, so I won't have time to debug until Tuesday. I've attached the obj dump if you want to see it. blog_os.objdump.txt
@roshangiyanani Sorry for the late reply!
Maybe you recompiled your binary between the -d int run and the objdump run? This would explain the below line as well:
test_breakpoint_exception... 0: v=03 e=0000 i=1 cpl=0 IP=0008:000000000020a0d0 pc=000000000020a0d0
Here the breakpoint exception occurs, but there is no int3 instruction at 0x20a0d0.
I ran into a similar triple fault in my project as well. It turns out that I had an errant space in my target triplet which prevented SSE feature from being disabled. What tipped me off was seeing the use of XMM registers in the objdump output recommended by @phil-opp.
--- a/x86_64-blog_os.json
+++ b/x86_64-blog_os.json
@@ -11,5 +11,5 @@
     "linker": "rust-lld",
     "panic-strategy": "abort",
     "disable-redzone": true,
-    "features": "-mmx, -sse,+soft-float"
+    "features": "-mmx,-sse,+soft-float"
 }
@dcarrier Oh wow. I hope the Rust target specifications become more robust against such errors soon.