phaser3 memory leak issue (all resources type)
Version
- Phaser Version: 3.22.0 & 3.50.0
- Operating system: macos catalina 10.15.7
- Browser: chrome Version 87.0.4280.88 (Official Build) (x86_64)
Description
There is a problem with all resources load, the memory usage too high, and no release when switch scene.
In my game, I have many images/audios (total 250MB), but memory usage 3GB...
I think this problem relate https://github.com/photonstorm/phaser/issues/5224
Example Test Code
I write a test code, just load same image url 1000 times(diff key),
-> then textures.remove(key) remove all keys
-> then switch to next scene
-> the memory no release (memory usage from 40MB to 464MB).
test url: https://justintien.github.io/phaser3_memory_leak_test/
source code: https://github.com/justintien/phaser3_memory_leak_test
This issue has been mentioned on Phaser. There might be relevant details there:
https://phaser.discourse.group/t/phaser3-memory-leak-issue/8423/1
This issue has been mentioned on Phaser. There might be relevant details there:
https://phaser.discourse.group/t/debugging-high-memory-usage/8161/2
Just want to confirm that we've been experiencing the same thing (we're on 3.50.1 at the moment [EDITED]). Safari regularly piles up memory until it resprings, then memory piles up and it resprings again, etc. I think it's probably an Apple bug, but there might be something Phaser is doing that's tickling it in the wrong way - it would be interesting if we figure out what, it might just be something really small somewhere.
Have been fixing an issue with a storybook application (pretty much an image flipbook) which was running out of memory on load on a Kindle Fire 2017.
I implemented load / unload of textures on each page flip and it then loaded ok but crashed at page 30. Forcing Canvas however and it now works fine when combined with loading / unloading on demand.
This potentially points the finger at webgl not releasing textures?
Not necessarily I'm afraid. WebGL will use more memory than canvas just by virtue of having to create all the gl textures (as well as loading the images), so it's possible it just ran out by that point. When a texture is deleted by the Texture Manager it is passed to the renderer to delete the gl texture too. Perhaps this process needs trapping to ensure it is actually removed. Although I suspect the issue is elsewhere personally.
This is either Mac, or Audio, specific. Because with the given test (https://justintien.github.io/phaser3_memory_leak_test/) I cannot see any memory retention at all in Chrome Canary on Windows. How exactly are you monitoring the memory use?
Not sure if that's a question for the OP but in our case: We were testing on Kindle 2017 Silk browser which actually has a crash in the tab (not a js crash, the whole tab errors) if you load too many things in. Loading and unloading as we go using
scene.textures.remove(...)
scene.textures.removeKey(...);
This does not work in webgl mode (eventually crashes after loading too many textures) but does work in canvas mode.
I realise it's not exactly scientific using the Silk Broswer to check if a memory limit has been his mind.
@photonstorm
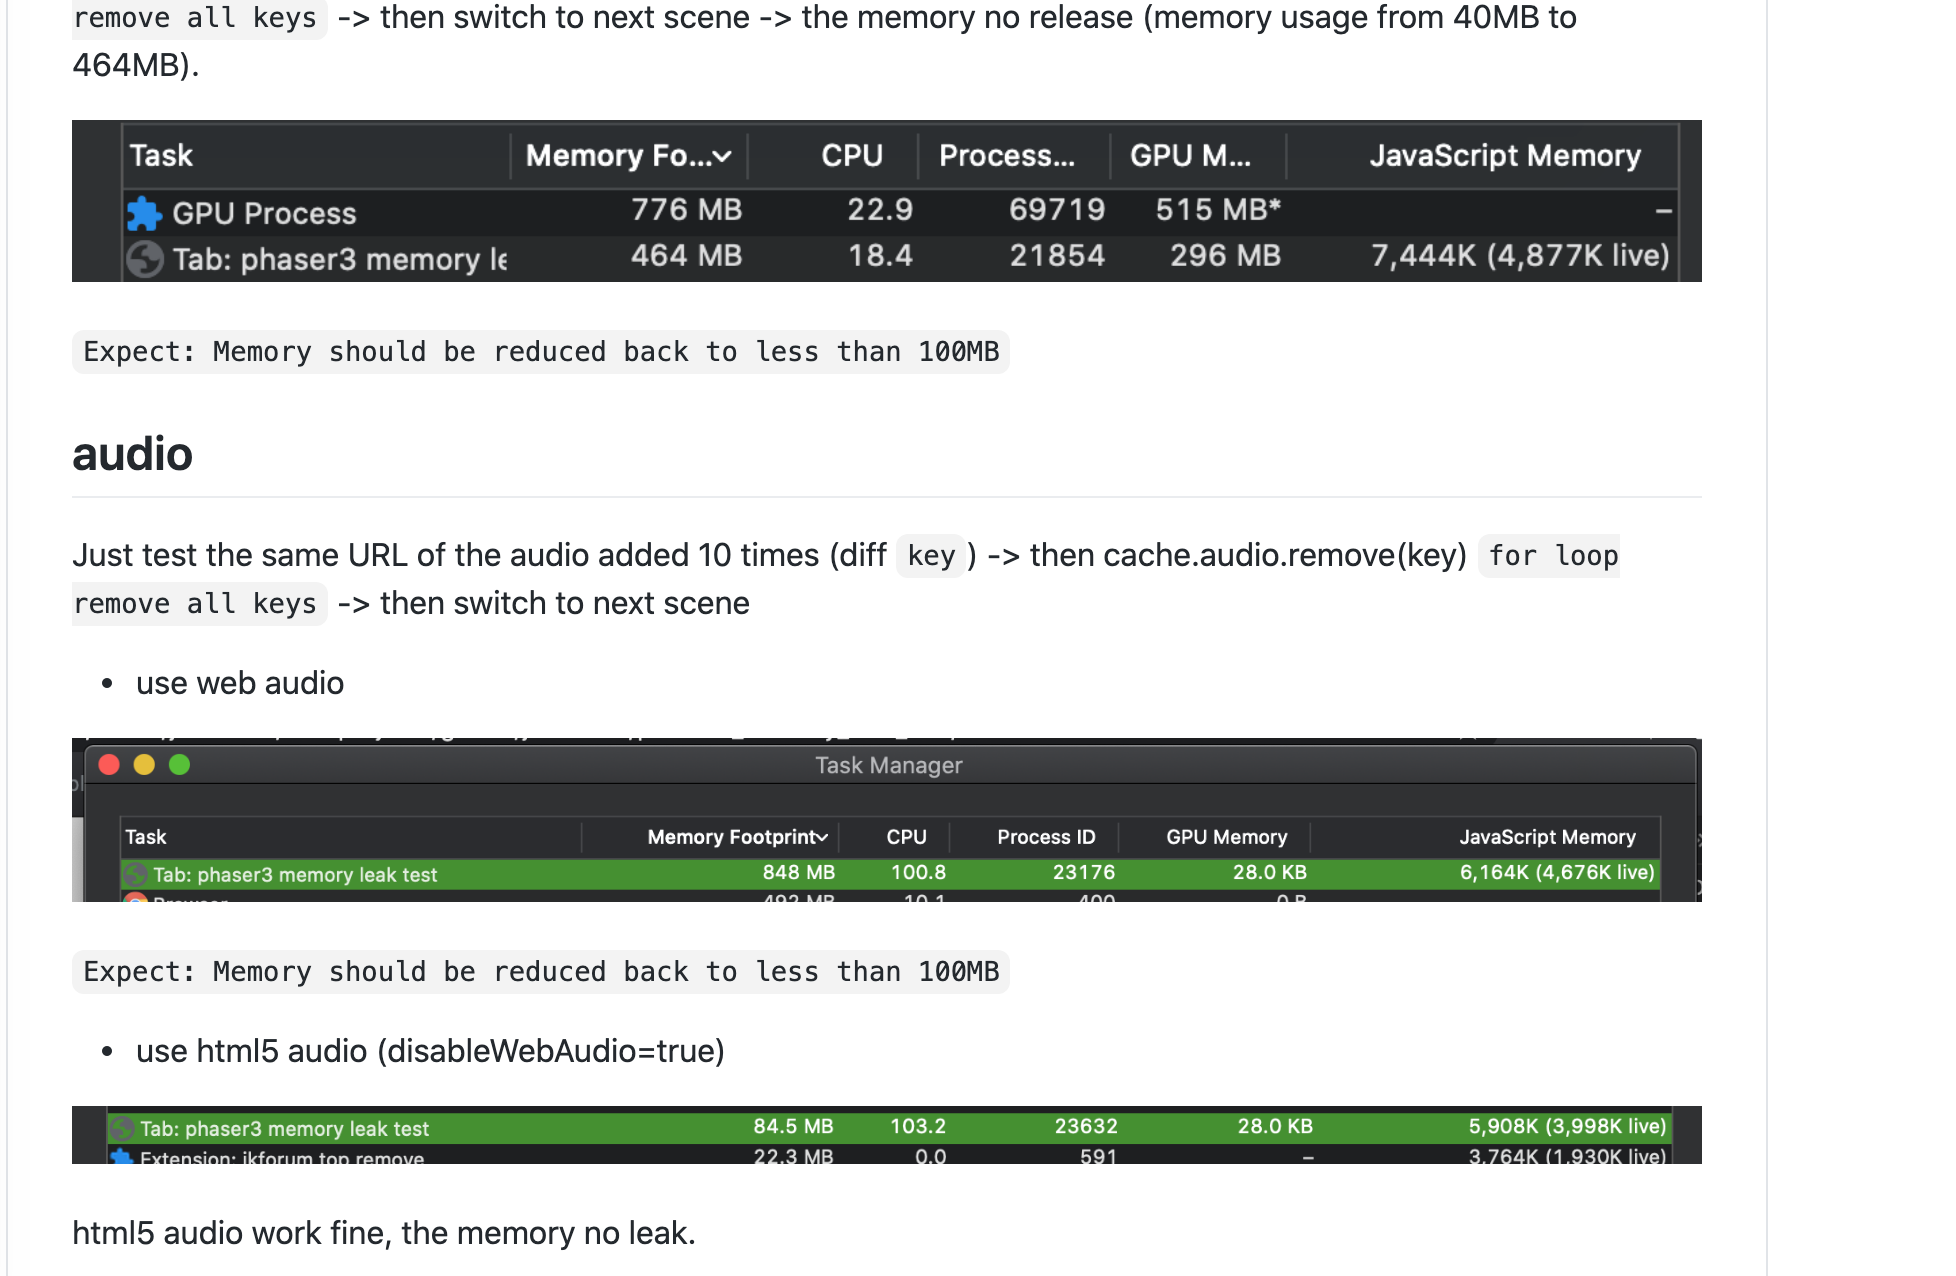
I added audio test: (In fact, I found the reason, about audio only memory leak when use web audio, html5 audio no leak when remove cache.)
web audio: https://justintien.github.io/phaser3_memory_leak_test/audio
html5 audio: https://justintien.github.io/phaser3_memory_leak_test/audio-disableWebAudio
This is either Mac, or Audio, specific. Because with the given test (https://justintien.github.io/phaser3_memory_leak_test/) I cannot see any memory retention at all in Chrome Canary on Windows. How exactly are you monitoring the memory use?
Empty phaser3 instance memory < 100MB,
In fact, the texture have release some memory, when added 1000 images -> 450MB -> textures remove all -> 150~250MB But there is still some occupation left (I don't know who is occupying it)
I've been looking at this a lot this morning and I'm more convinced than ever it's just the browser holding onto those nodes, for reasons best known only to itself.
This is clearly demonstrated by doing the following:
Run your test app (the one with the images, not the audio, that is a different issue) and watch the Chrome Task Manager memory footprint for the tab increase. In my case, it went from 45MB to 312MB when the images had loaded. I then click to the next Scene. The images are definitely gone, they no longer exist in the texture manager and the GL textures have been deleted as well. However, the memory footprint remains unchanged.
Now, do one of two things: Either click the 'Collect garbage' icon in Dev Tools (the trash can icon in the Performance pane), or tab away from Chrome to another application (i.e. VS Code, like I did) and work there for a few minutes. Both things cause the browser to run a gc sweep. Obviously, the icon triggers it immediately and you will see an instant drop in the memory footprint as it purges all of those nodes it was retaining, for reasons best known only to the browser.
This also happens if you tab away from Chrome and use another app. After a while, Chrome will think "Ok, it's safe, let's run a gc sweep now" and memory will drop dramatically. Here you can see the green line (nodes) plummet from 749 down to 249, releasing hundreds of MB of memory at the same time:

This was triggered by me clicking the Collect Garbage icon.
If it was Phaser that wasn't cleaning up memory or references, then clicking this icon would make no difference. However, it makes a massive difference.
In short, given how browsers operate, it's unpractical to expect them to free memory like this, as you demand it. It just doesn't happen that way. It happens when they feel like it, not when you ask them to. You're welcome to research how it may be possible to request a browser triggers gc, but to date, I've not seen any ways to do it. I do wonder if 'pausing' the game may be enough, i.e. literally letting raf idle for a second or so. But that would be quite noticeable in-game and isn't guaranteed either.
I do, however, firmly believe there is an issue with audio memory, so I will look into that as a different matter.
You need to switch scenes frequently, and then you can see the phenomenon of memory skyrocketing
Try to release Phaser.Game textures, sound effects and other resources when switching scenes. This will greatly alleviate the gc problem
As I've demonstrated Phaser will correctly free all references to the resources on its end. Changing Scene won't alter this.
Let me add to this discussion - i have a Safari-specific leak, where safari keeps on piling up Canvases created by RenderTexture (rendermode: CANVAS) - even when these Canvases are destroyed 'through scene switch' (some users seem to be experiencing this). The issue is perfectly described here, along with a fix (a fix which i tried and helped to ameliorate the issue, but not entirely fix it): https://pqina.nl/blog/total-canvas-memory-use-exceeds-the-maximum-limit/
As an attempt to completely fix this, i'm implementing a global object pool for RTs that would persist across scenes and cache - rather than destroy - these RTs to prevent destroy/new being called on each creation/destruction and be uncollected by Safari GC. However there is other issue/bug with 'asset duplication' when moving things across scenes to cache them i have to deal with also (link).
EDIT 2022/04/28 I've just managed to implement an object pool for RenderTextures, but the same problem persists - switching scenes frequently, textures eventually start missing, until memory piles to the point that the app crashes (Safari throws an error that max alloc memory was exceeded >384MB). My app uses texture atlases from which it creates Images, no Sprites etc. It does use few particle effects, i'm destroying those too. So it is apparently not specifically RenderTexture related, but some other assets, that should get auto released by Phaser are not on Safari (not saying this is Phaser issue, it seems to be not (other browsers work flawlessly), but is there any solution to this even outside of Phaser that anyone can suggest (specifically for iOS15 Safari)?
EDIT 2022/04/28-2 Seems to be unrelated to specifically RenderTexture (although using that might arrive to the OOMEM crash sooner). Tested without RT still produced crashes. Safari simply doesn't seem to release unreferenced objects from memory as other browsers do. Perhaps for another project, id use a different code structure to target this specific issue - one heavily reliant on 0 scene switches/destroys, single initial allocation of each object and asset pooling/reuse).
Under 3.60 RenderTextures no longer create or use Canvas DOM elements at all in WebGL, which will stop the node issues described here (also uses 50% less memory!).
However, we've still no control over when (or if) Safari feels like free-ing up memory or running a gc sweep. Everything is nulled or removed our end, but my suspicion is that because RAF is running and is likely busy running a game (so CPU is high), Safari doesn't consider it a 'safe' time to run a gc, so it just doesn't bother. For a normal web page, you would expect high levels of idle activity, but this just isn't the case for games, so the retention period appears to be significantly longer.
The day we get accurate control over memory / gc will be a day to celebrate. Just don't hold your breath!