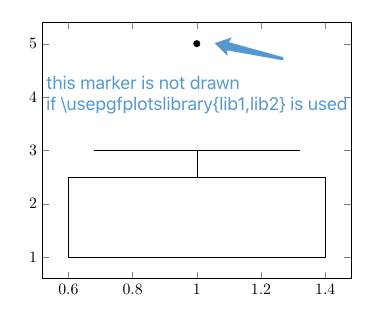
\usepgfplotslibrary{lib1,lib2} may give wrong output
From TeX-SX question https://tex.stackexchange.com/q/568789
Compared to loading one lib at a time, loading multiple libs at a time may give wrong output.
\documentclass{article}
\usepackage{pgfplots}
\pgfplotsset{compat=1.17}

% get expected result
\usepgfplotslibrary{statistics}
\usepgfplotslibrary{fillbetween}

% get wrong result, the circled marker is not drawn
%\usepgfplotslibrary{statistics,fillbetween}

\begin{document}
\begin{tikzpicture}
    \begin{axis}[boxplot/draw direction = y]
        \addplot [boxplot] table [col sep=comma,y index=0] {
          1
          1
          2
          1
          1
          3
          5
        };
    \end{axis}
\end{tikzpicture}
\end{document}
In the TeX-SX answer given by @u-fischer, she pointed out that the problem is caused by
https://github.com/pgf-tikz/pgfplots/blob/e4b3ec4c9caeb7444487a1d0e87cadedbed6893d/tex/generic/pgfplots/libs/pgfplotslibrary.code.tex#L53-L57
in definition of \use@@pgfplotslibrary, and
The problem is that
#1isstatistics,fillbetweenorfillbetween,statisticsif you combine both in one command, and so the test is always false.So it is a bug but simply replacing
#1by\pgf@tempdoes not work, as these library calls can be nested and so the value is not correct in all cases.
IMHO the more important issue is that the wrong library gets loaded, see https://tex.stackexchange.com/a/568816/227820.