pgfplots
 pgfplots copied to clipboard
Median calculation
Hello!
The problem is related to this question: https://tex.stackexchange.com/questions/530278/median-calculation-in-boxplots
If you look at at the example from https://gonike.github.io/pgfplots-boxplots/ the median of 22, 26, 30, 17, 45 is not determined with 26 but with 24 (=0.5*(22+26)) according to the the documentation on page 500 (Revision 1.17, 2020/02/29).
I think the definition of the median should be exactly the opposite (if N* p is not an integer number e.g. 7* 0.5 -> the 4. value should be chosen).
Thank you very much & kind regards, Max
I don't think that the default will be changed. Maybe an option could be added to chose on how to calculate the median in case of N·p not being an integer.
Feel free to provide a pull request or patch.
Hello!
Thank you for your response!
On which literature/sources is the used definition of the median based? I could only find the definition I mentioned in the first post.
Kind regards, Max
Unfortunately that can only answer the original author @cfeuersaenger, who currently is inactive ...
I guess the problem comes from the formula pgfplots uses to calculate p-quantile.
Currently, from pgfplots.pdf v1.17, pp. 499--500, given data sample x[1...N] and 0 <= p <= 1 (sorry I markup formula as inline code to force the use of mono font),
p-quantile = x[k]                               if k is integer,
             1/2 x[floor(k)] + 1/2 x[ceil(k)]   otherwise
where k = N * p
But since the sample is indexed from 1 (not from 0), perhaps k = (N - 1) * p + 1 is better. This gives k = 1 when p = 0, k = N when p = N, and k = (N+1)/2 when N is odd (this is OP's case). There might be historical or practical reason I don't know that forces the use of k = N * p.
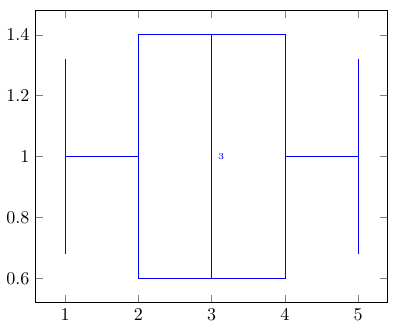
The above calculation takes place in \pgfplotsplothandler@boxplot@percentile@estimator@legacy, and the change from k = N * p to k = (N - 1) * p + 1 is simple:
\begin{filecontents}{input.csv}
name,value
a,1
b,2
c,3
d,4
e,5
\end{filecontents}

\documentclass{article}
\usepackage{pgfplots,pgfplotstable}
\usetikzlibrary{pgfplots.statistics}
\pgfplotsset{compat=1.17}

\usepackage{xpatch}
\makeatletter
\xpatchcmd\pgfplotsplothandler@boxplot@percentile@estimator@legacy
  {\pgfmathparse{#1*#2}}
  {\pgfmathparse{#1*(#2-1)+1}}
  {}{\fail}
\makeatother

\begin{document}

\begin{tikzpicture}
  \pgfplotstableread[col sep=comma]{input.csv}\mydata
  \pgfplotsset{
      boxplot/draw/median/.code={
          \draw [/pgfplots/boxplot/every median/.try]
              (boxplot box cs:\pgfplotsboxplotvalue{median},0)
              --
              node[right, font=\tiny] {\pgfmathprintnumber{\pgfplotsboxplotvalue{median}}}
              (boxplot box cs:\pgfplotsboxplotvalue{median},1);
      },
  }

  \begin{axis}
    \addplot+[boxplot] table[x=value] {\mydata};
  \end{axis}
\end{tikzpicture}
\end{document}
 Note that this changes each of
 \pgfplotsboxplotvalue{median|lower quartile|upper quartile} used in box plot drawing.