Metrics of "mongodb_oplog_stats_start" is wrong
Describe the bug I am trying to use metrics: "mongodb_oplog_stats_start" and "mongodb_oplog_stats_end" to calculate "Replication Oplog Window".
While I found both "mongodb_oplog_stats_start" and "mongodb_oplog_stats_end" have the same value which is the end of the Oplog.
Expected behavior I expect "mongodb_oplog_stats_start" should have the value of my oplog's start value, which is days ago.
Logs Here is what I get from running the command against the mongod:
rp-mdb:PRIMARY> rs.printReplicationInfo()
configured oplog size:   6380.730712890625MB
log length start to end: 334635secs (92.95hrs)
oplog first event time:  Mon Nov 14 2022 13:24:43 GMT+0000 (UTC)
oplog last event time:   Fri Nov 18 2022 10:21:58 GMT+0000 (UTC)
now:                     Fri Nov 18 2022 10:22:03 GMT+0000 (UTC)
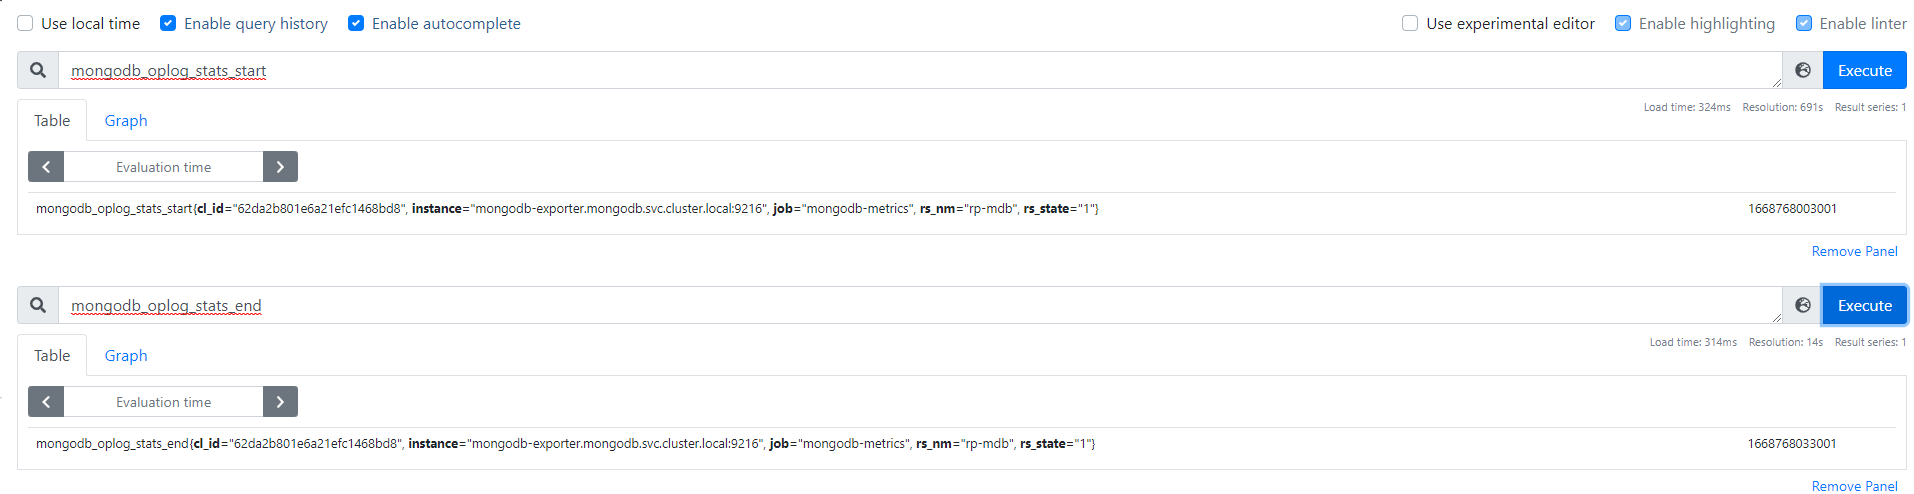
Here is what I got from the metrics using prometheus and percona mongo-exporter:
It is using unix milliseconds, but convert to datetime, it is basically the same as above last event time.
Environment
- I am using kubernetes(version Major:"1", Minor:"22")
- MongoDB version: MongoDB server version: 4.2.8
Had the same problem, it seems mongodb_oplog_stats_start and mongodb_oplog_stats_end are fetched from the diagnostics data (db.getSiblingDB('admin').runCommand({"getDiagnosticData": 1});) which is something different.
mongodb_mongod_replset_oplog_head_timestamp and mongodb_mongod_replset_oplog_tail_timestamp looks to be correct and are calculated from the latest and earliest entries in the oplog.