cpu profiler labels don't show up in parca
Hi! First, thank you for parca 😄
I am trying to add labels to my CPU profiles so I can filter profiles in parca.
parca, version 0.15.0 (commit: 287d49e66fbf1a362d45d7233162cea6f55dbdc2)
I read https://www.polarsignals.com/blog/posts/2021/04/13/demystifying-pprof-labels-with-go/ and the parca docs. I feel stuck 😅
Here is a simplified example of my code
package main

import (
        "context"
        "io"
        "log"
        "net/http"
        "net/http/pprof"
        rpprof "runtime/pprof"
        "strings"
)

func main() {
        mux := http.NewServeMux()
        mux.HandleFunc("/debug/pprof/", pprof.Index)
        mux.HandleFunc("/debug/pprof/profile", pprof.Profile)
        mux.HandleFunc("/work", work)
        srv := http.Server{Addr: "localhost:6060", Handler: mux}
        log.Fatal(srv.ListenAndServe())
}

func work(w http.ResponseWriter, r *http.Request) {
        labels := rpprof.Labels("my", "label", "method", r.Method, "endpoint", r.URL.Path)
        rpprof.Do(r.Context(), labels, func(_ context.Context) {
                var sum int
                for i := 0; i < 1_000_000_000; i++ {
                        sum++
                }
                io.Copy(w, strings.NewReader("lots of work\n"))
        })
}
I then generate some load using
while sleep 0.1; do curl http://localhost:6060/work; done
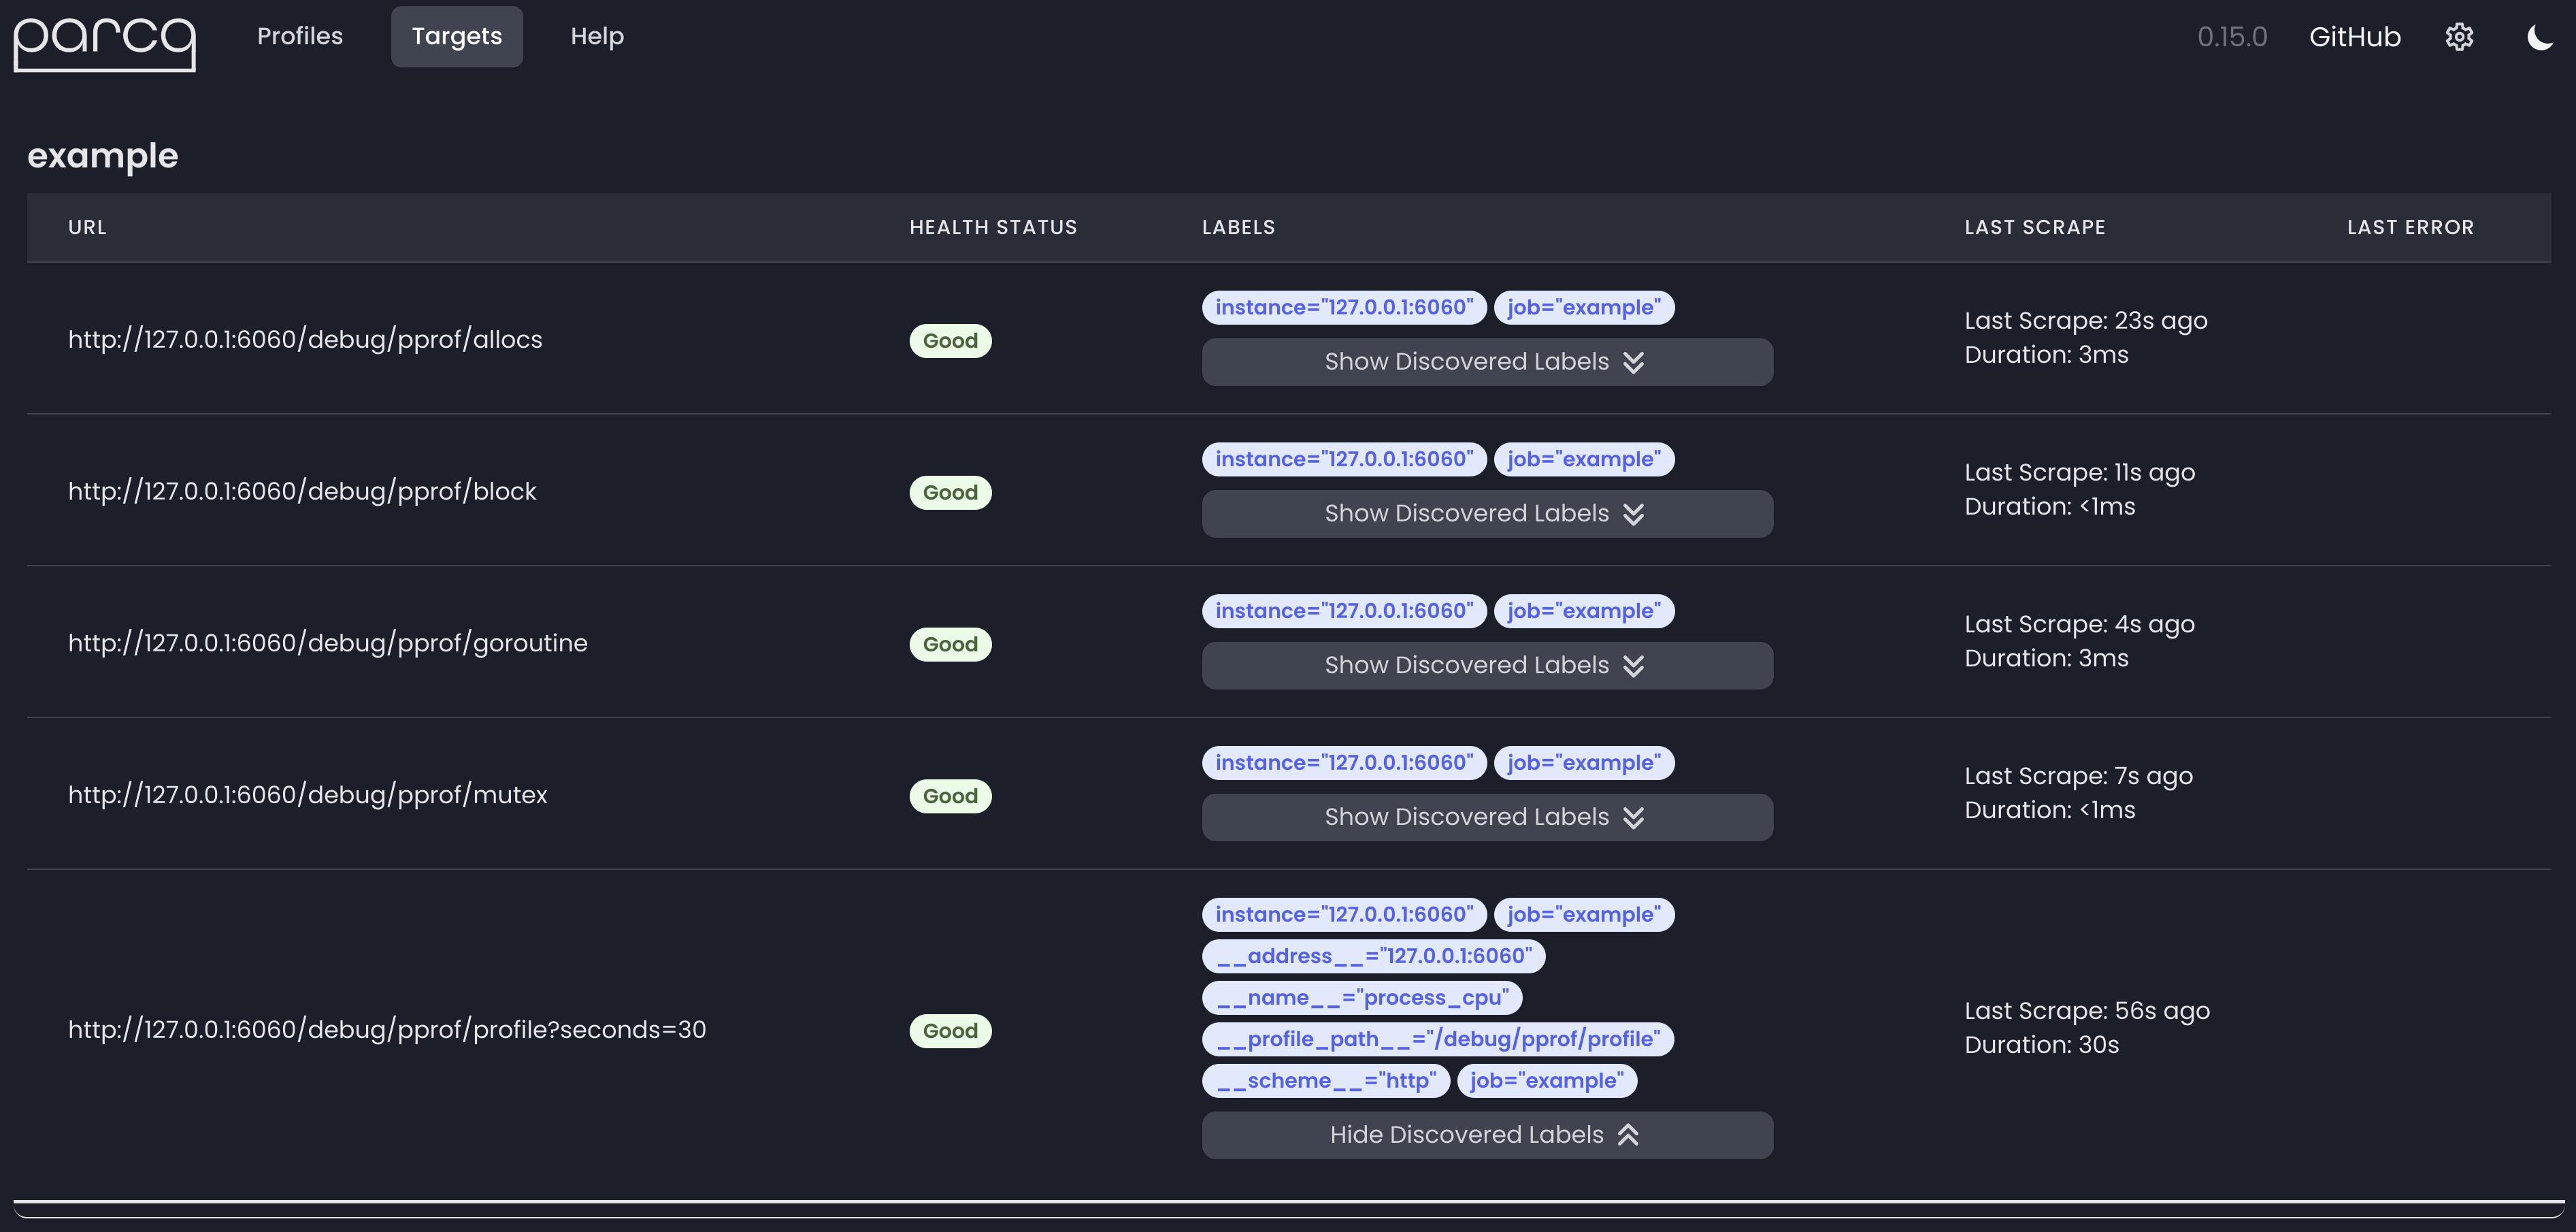
The tags don't show up in parca in pprof/profile
They are also not in the profile I can download from parca and inspect using go tool pprof.
go tool pprof ~/Downloads/profile.pb.gz
File: main
Type: samples
Time: Feb 24, 2023 at 5:50pm (CET)
Entering interactive mode (type "help" for commands, "o" for options)
(pprof) tags
(pprof)
The tags are in if I directly get the profile using go tool pprof
go tool pprof http://127.0.0.1:6060/debug/pprof/profile?seconds=30
(pprof) tags
 endpoint: Total 21.2s
           21.2s (  100%): /work

 method: Total 21.2s
         21.2s (  100%): GET

 my: Total 21.2s
     21.2s (  100%): label
The parca logs don't show any errors. When I set log level to debug I see
level=debug name=parca ts=2023-02-24T16:54:23.54855021Z caller=scrape.go:473 scrape_pool=example target="http://127.0.0.1:6060/debug/pprof/profile?seconds=10" msg="appending new sample" labels="{instance=\"127.0.0.1:6060\", job=\"example\", __name__=\"process_cpu\"}"
Is there anything I need to configure for it to take my custom label? Sorry if the solution is obvious 😅
While parca stores these labels they’re not included in the queries yet. We’ve done all the ground work though it should only be a few lines if you want to give it a stab:
https://github.com/parca-dev/parca/blob/e62b444edbd7dd391f1e2d05cfee5e6d94cb7cb8/pkg/parcacol/querier.go#L172
Here we should be doing a logical “or” where the same matcher is added but not just with the “labels.” prefix but also the “pprof_labels.”
I think that should do the trick. Let us know if that works and if not I’ll look at it first thing next week!
Thank you @brancz I'll give it a try 😄
How is it that parca stores the labels but the labels are not in the profile I can download from parca? 🤔
Looks like we don't aggregate them away when querying from the database:
https://github.com/parca-dev/parca/blob/73f3f1d15a50e02fef244b9441b99f4a3d22a40a/pkg/parcacol/querier.go#L918-L938
But in the pprof download, we appear to (incorrectly) not add the labels again:
https://github.com/parca-dev/parca/blob/73f3f1d15a50e02fef244b9441b99f4a3d22a40a/pkg/query/pprof.go#L155-L158