jupyter-earth
 jupyter-earth copied to clipboard
Published
20 hours ago •
 pangeo-data
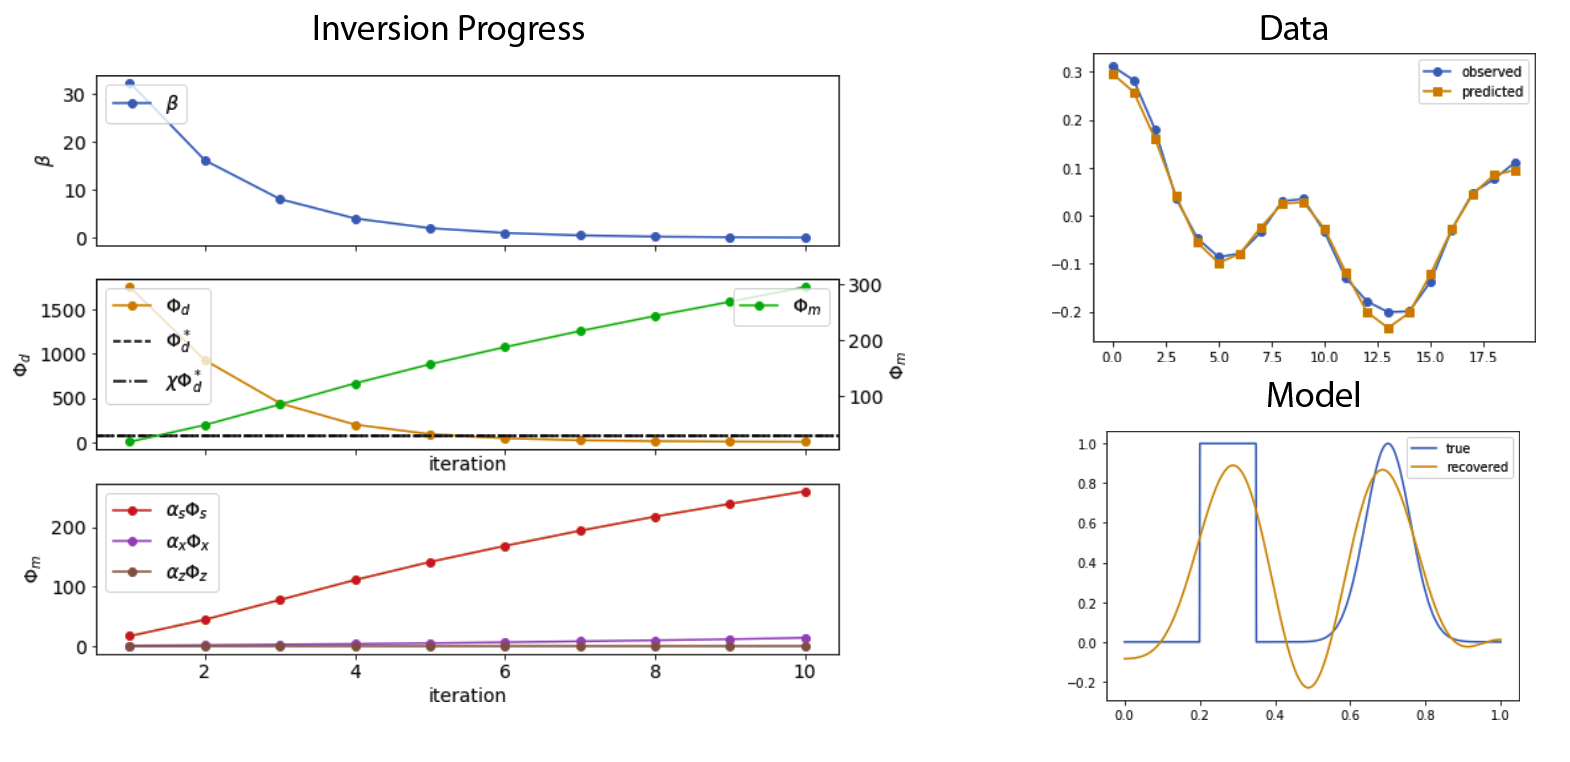
Demo linear inversion dashboard
The goal of this issue is to track the development of a simple demo that provides a dashboard with real-time streaming of data that is informative to see during a running inversion.
Sketch of the problem
For a first example, I plan to start with a linear inverse problem that uses decaying exponential kernels. This is one of the first problems most folks explore when being introduced to geophysical inversions and is computationally lightweight.
As an inversion is running, the dashboard should show:
- tikhonov curves: data misfit, regularization, trade-off parameter beta
- observed and predicted data
- model at current iteration
and we should be able to scroll back through previous iterations.
Initial tech choices
I am planning to start by following the example on Streaming with Zarr. This example uses Bokeh for plotting and redis for streaming.
Other considerations
- The dask dashboard is another example that we should look at for an example of live-updating of plots
- Similar work was previously done with IPython parallel for streaming information