Changing the scale of the x axis
Steps to reproduce
You will find the source that I use for testing in repo https://github.com/pavlexander/plot_test
The code I use for plotting is
            var candles = GetCanles();
            var plottableCandles = OxyConverter.ConvertToPlottalble(candles);

            var form = new OxyChartForm();
            var plot = form.MainPlot;
            form.Show();

            // create the model and add the lines to it
            var model = new OxyPlot.PlotModel
            {
                Title = $"Candlestick chart"
            };
            model.Series.Add(plottableCandles);

            // load the model into the user control
            plot.Model = model;
Platform: .NET 6, Winforms
Expected behaviour
It's possible to scale the X-axis
Actual behaviour
Not possible to scale. See the feature description below.
Feature description
I am looking for a way to change the scale of the X axis. Currently, after zooming in - all the data is "concentrated" into a small time frame.
Zoomed out data
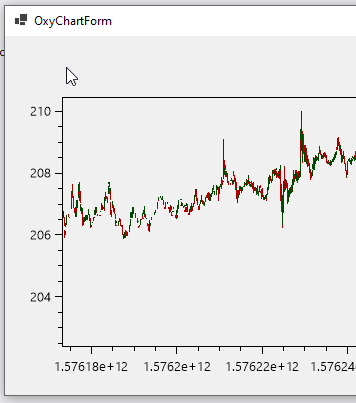
Zoomed in data

As you see all the data on zoomed-in chart is located very close one to another. I would like to have a feature to be able to stretch the X-axis with either the right mouse button click or with SHIFT/ALT/CTRL combination with a either of the mouse buttons..
For an example you could look at ScottPlot implementation. Right mouse button controls the scale of the X and Y axis at the same time like so

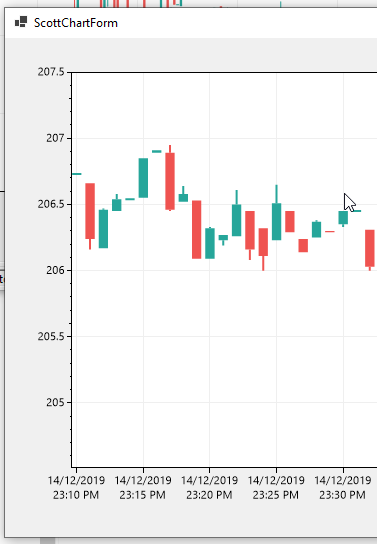
The feature should allow to control the scale of the x-axis. This should assist in usability of the plotting library. Currently on candlestick chart the candles are located very close to each other, making the chart hard to "read"/use.
This is unlikely to be included as a default feature, but I implemented something similar a while back for a project.
See the ScaleAllManipulator in this gist: https://gist.github.com/VisualMelon/e1e68246486e62fa0f31340524944c39 (include code to assemble a PlotController (which you need to assign to your PlotView) which binds Right-Mouse and Ctrl to a stretch/squish tool. Alt/Shift modify the nature of the scaling (e.g. fixed aspect, fast/slow)
Note that you can scale individual axes already when the mouse-wheel is located over them, or by middle/ctrl-dragging over them to focus on a specific region on the plot.