Project: implement the interactive charts block for topic pages (v2)
Follow up to #1380
Core problem
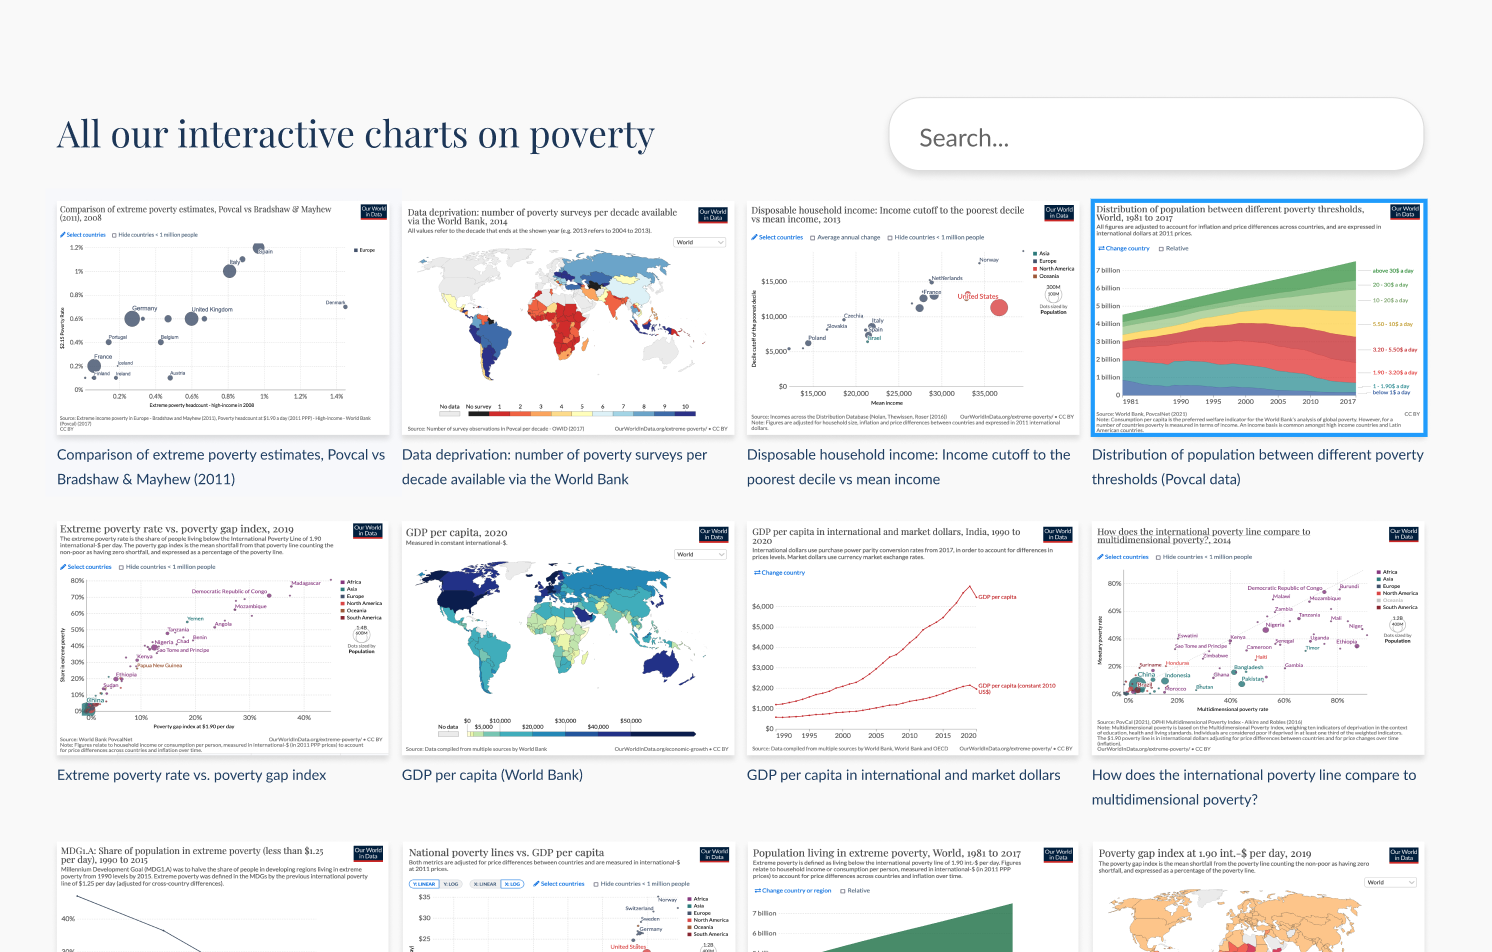
We want to surface all the charts relevant to a topic on the corresponding topic page.
Status (July 9, 2022): ⚠️ blocked by technical text
- #1529 acted as a fallback for this v2. Work on the lightbox has been paused given the absence of content in the left pane:
- the list of related charts has been removed on the account of being confusing
- "this chart is listed in the following articles" section is for now too infrequent
- technical text is not available yet
- current progress on v2, as well as possible next steps once technical text is available is in #1524 (comment)
Scope
essential / important - now
- [x] All charts related to a topic are listed somewhere in the topic page
- [ ] visually differentiate key charts from non-key charts
- [x] “keyness” is an attribute of a chart in a particular topic
- [x] #1520
- [ ] on click, open chart in lightbox
- [x] #1498
- [ ] #1510
essential / important - later
Support material
Versions
- v1: #1380
- v2-alpha1: demo, technical plan, code
- v2-alpha2: demo, code
- v3: #1529
(originally submitted in https://github.com/owid/owid-grapher/issues/1380#issuecomment-1105188499)
--
Below is a comparison of the different search architectures we could rely on: Algolia or local JS filtering on the page
| Features | with Algolia | without Algolia |
|---|---|---|
| search through title, subtitle, tags and country | 👍 | 😕 |
| can benefit from current site search configuration | 👍 | ⛔️ |
| country selection from natural language | 👍 | 👍 |
| search analytics | 👍 | ⛔️ |
| potential for more unified UX between site search and chart search | 🙂 | 😐 |
in the future faceted search (demo) |
🙂 | 😟 (current topic only) |
in the future search can expand up and down the topic hierarchy without leaving the page (same demo) |
🙂 | 🥵 |
The table below describes how this particular block could be baked and served on page load, prior to any search. To the traditional UX and SEO advantage of SSR, there is here another dimension to take into consideration: Algolia's search quota.
| Baking scenarios | with Algolia | without Algolia |
|---|---|---|
| baking without SSR from Algolia index | 😡 means the block would be empty until a search is performed or the block would be populated lazily on scroll, hitting the search quota up to the number of page views on any given topic | N/A |
| baking with SSR from Algolia index | 😡 would likely burn through (public) search quota (200K): 20 bakes / day * 300 topics * 30 days = 180K (probably ok in the short term until we deploy these blocks at scale, but not desirable in the long term) | N/A |
| baking with SSR from internal grapher DB | 😕 means there might be a discrepancy between what is listed at page load, and what is then returned upon search by Algolia (since the index is only refreshed weekly). As topic pages and their associated charts mature, this will be less of an issue) | 🙂 |
Verdict
From my perspective, an Algolia implementation keeps more doors open for the future than a custom filtering widget and is my recommendation at this point.
The original time investment is similar given the reliance on the existing search infrastructure (site search), and will likely be much less as we add more complex features.
This comes at the cost of possible discrepancies between the initial page load and further search queries, which will gradually disappear as topics mature. One additional perspective is that in the absence of search queries, no discrepancy can and will be surfaced.
@danyx23 @larsyencken I'd be interested to hear your take on this
Implementation intentions:
1. Content graph
1.1 List all charts using SSG (serveur-side generation), then when clicking on "search", start Algolia with facets filtering exposed
confidence 95%
- see rationale above
- see demo in Searching and exploring the graph
1.2 Use all our charts block as the source of truth for chart <-> topic(s) relationships
confidence: 90%
This is reversing some of the work in #1070 and #1455, where topics are defined in the grapher admin, as an attribute of the chart. The upshot of this approach are:
- conceptually and technically, this helps with disentangling grapher and Wordpress. Topics remain an artefact of the publication that grapher doesn't need to know about. From a product perspective, grapher can still ship with tag management for internal organisation, but these are not used for publishing on OWID.
- the relationship chart <-> topic can be ordered and defined in the same place
- there is natural support for multiple topics per chart, all the while allowing different ordering on every topic (a chart might be in the top 5 on one topic, but further down the list on another). Achieving this at the chart editor level seems more complex, and would probably require an additional "topic overview" screen to do the ordering (which diminishes the gain of having it in the admin).
- publishing a chart on an OWID topic is conceptually more understandable: instead of using tag that is shared between the entry and the chart (see "All our charts" block), authors will insert that chart onto the page directly, so there is less "magic" to contend with.
2. Lightbox
2.1 Apply lightbox feature on all grapher prominent links, including on entries and posts
confidence: 85%
- no grapher page dead-end
- would probably require some visual differentiation with non-lightbox prominent links
2.2 Use the grapher page as the content of the lightbox
confidence: 95%
- the content of the grapher page is evolving towards the content of the lightbox: chart + back references + technical text. It makes sense to merge them conceptually and technically
- keeps "scatterdness" at bay (one concept = one UI)
3. CMS
3.1 Use prominent links as the CMS element to insert charts in the grid
confidence: 80%
- they are semantically identical to the chart cards
- prominent links get automatic images and titles, and support chart redirects
- prominent links can be converted automatically by copy / pasting a list of links in the editor
3.2 Repurpose prominent links default's style (large)
confidence: 60%
- the large variation is not being used anymore, updating it to match the grid card style would only affect a few instances on the site
- keeps maintenance low
v2-alpha1
Front-end prototype
https://user-images.githubusercontent.com/13406362/171004543-b515a7ec-063e-4a62-b904-e76c9f1d91a6.mp4

An author-centric comparison of connecting orphan (non-key, non-article) charts to topics, either through grapher tags (current) or through chart mentions in topic pages.
Key charts or article charts do not fall into that comparison: in both current and future implementations, these charts are directly injected into the content graph through their mentions.
| Current: grapher tags | Proposed: manual embed in topic pages | |
|---|---|---|
| Connect a chart to a topic | - go to /admin/posts and look up the page the chart needs to be attached to (this may be skipped if the author is familiar with the topic) | - go to the relevant topic page |
| - choose an existing tag among the page tags or create a new one | - copy the embed code and paste it in the content | |
| - go to /admin/charts, locate the chart and tag accordingly | ||
| Move a chart to another topic | - remove tag | - go to the old topic page |
| - re-tag following the above procedure | - cut the embed code | |
| - go to the new topic page | ||
| - paste the embed code | ||
| Rename a topic | To maintain 1:1 coherence, go to /admin/tags and rename the associated tag too | (nothing more to do) |
| Delete / merge / split a topic | Migrate charts to new / existing tag(s) (can this be done through the bulk FASTT editor?) | Follow "Move a chart to another topic" |
| Main advantage | Charts can be tagged in the admin | Predictable: a chart is in the list if it has been pasted in |
| Main inconvenient | Coherence needs to be manually maintained by authors: grapher tags kept in sync with topic names, and grapher tags attached to pages (or reattached in case of deletion). Complex to reason with, prone to mistakes. | We need to find a place for orphan charts on the topic page (or in another page / article connected to that topic). Copy / paste feels more manual. |
v2-alpha2
Demo (feature complete):
- all features in current scope
- backend tagging in the admin is handled in #1520
https://user-images.githubusercontent.com/13406362/176641716-672e3bba-9ae3-4564-8ee9-42001b1d0df9.mp4
This also ships with a refactor a the grapher page (see rationale in technical plan)
Closing.
Due to the absence of technical text in the foreseeable future, the lightbox set-up designed for https://github.com/owid/owid-grapher/issues/1447 is blocked and has been postponed (and with it the implementation PR https://github.com/owid/owid-grapher/pull/1524).
As of July 2022, the version of the all charts block in production is https://github.com/owid/owid-grapher/pull/1529.
cc @mathisonian @larsyencken