KafkaPeek
 KafkaPeek copied to clipboard
KafkaPeek is an open-source application designed to help developers visualize, monitor, and stay up-to-date on their Kafka deployments
trafficstars

KafkaPeek
KafkaPeek is a developer tool that monitors key metrics in your local Kafka deployment.
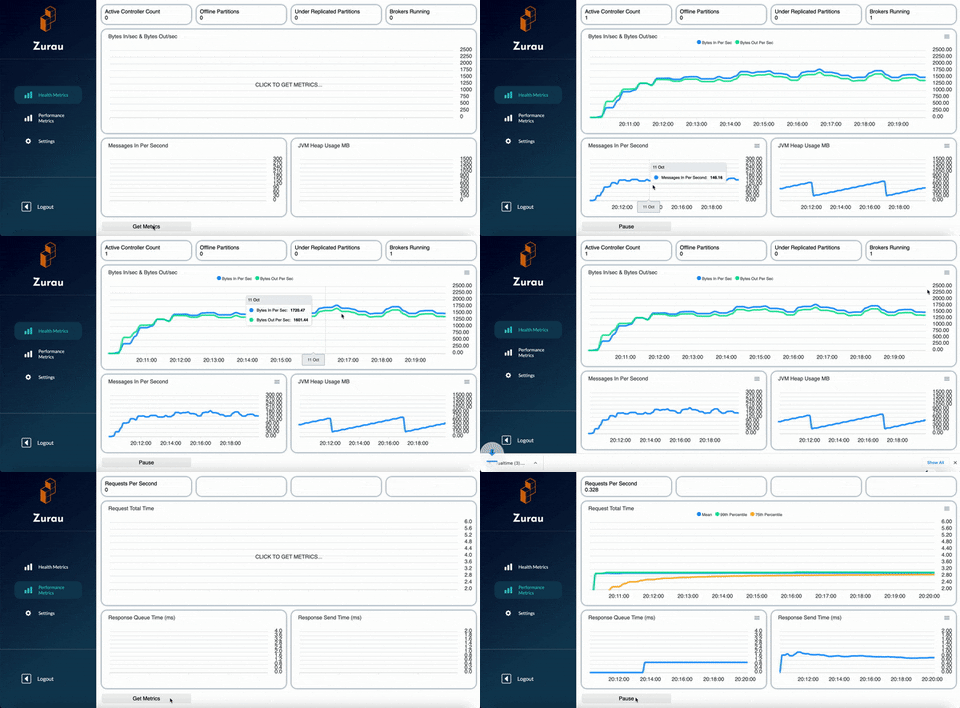
Key Health Metrics Tracked
- Bytes In Per Sec
- Bytes Out Per Sec
- JVM Heap Usage (MB)
- Under Replicated Partitions
- Offline Partition Count
- Active Controller Count
- Brokers Running
Key Performance Metrics Tracked
- Requests Per Sec
- Request Total Time (s)
- Request Queue Time (ms)
- Response Send Time (ms)
Tech Stack
Client: React, React Router, ApexCharts, Socket.io
Server: Node, Express, Socket.io KafkaJS
DevOps: Apache Kafka, Prometheus, JMX Exporter, Grafana, Docker, Git, Github
Features
- Live monitoring of key health metrics of a Kafka Broker
- Secured login through Github OAuth
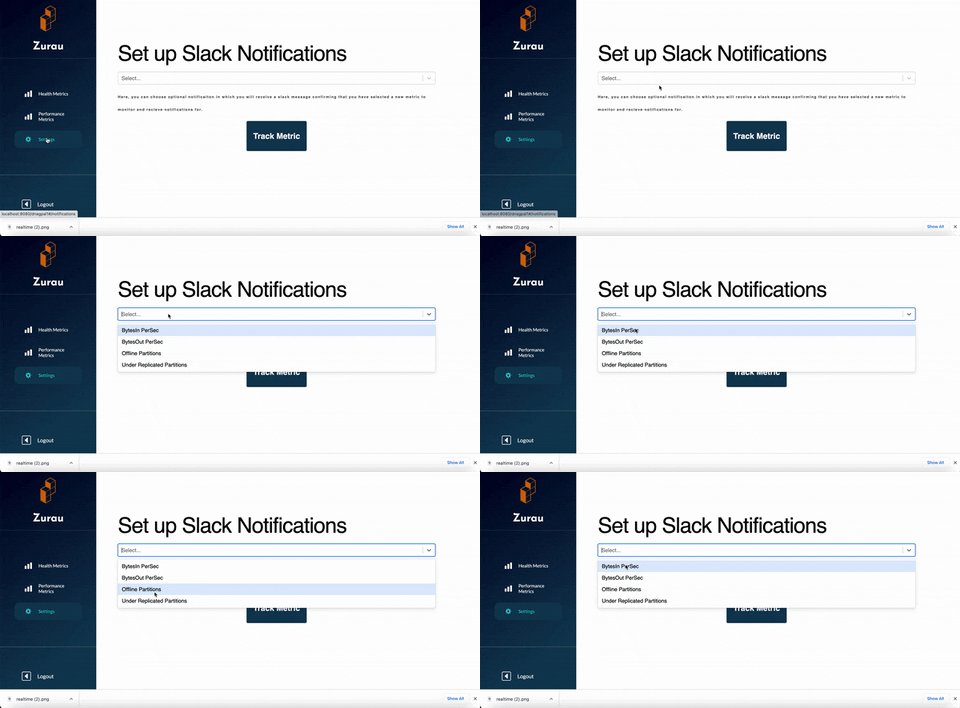
- Slack alerts if metrics go beyond user set specifications
- Customization of dashboard metrics based on the organizations needs
- Ability to save graphs in real time
Installation
Install KafkaPeek with npm to install all dependencies
npm install
Deployment
To deploy this project run the following commands in the terminal:
- Deploy your kafka cluster
docker-compose up
- In a new terminal window, deploy the producer:
npm run start:producer
- In a new terminal window, deploy the consumer:
npm run start:consumer
- In a new terminal window, deploy the application on:
Deploy application on dev server (localhost:8080)
npm run dev
OR
Deploy application on production server (localhost:4000)
npm run build
then
npm start
Now you have a fully functioning Kafka broker with one demo producer and consumer.
Demo
Main Dashboard

Slack Notifications

Running Tests
To run tests, run the following command
npm run test socketIOtest.js
npm run test supertest.js
Roadmap
- Web Based Application
- Customized Developer Options
- Github OAuth Authentication
- User Account Information
- User Settings
- NoSql Database - Error Logs/Accounts/Archived Metrics