GraalVM/JS memory leak
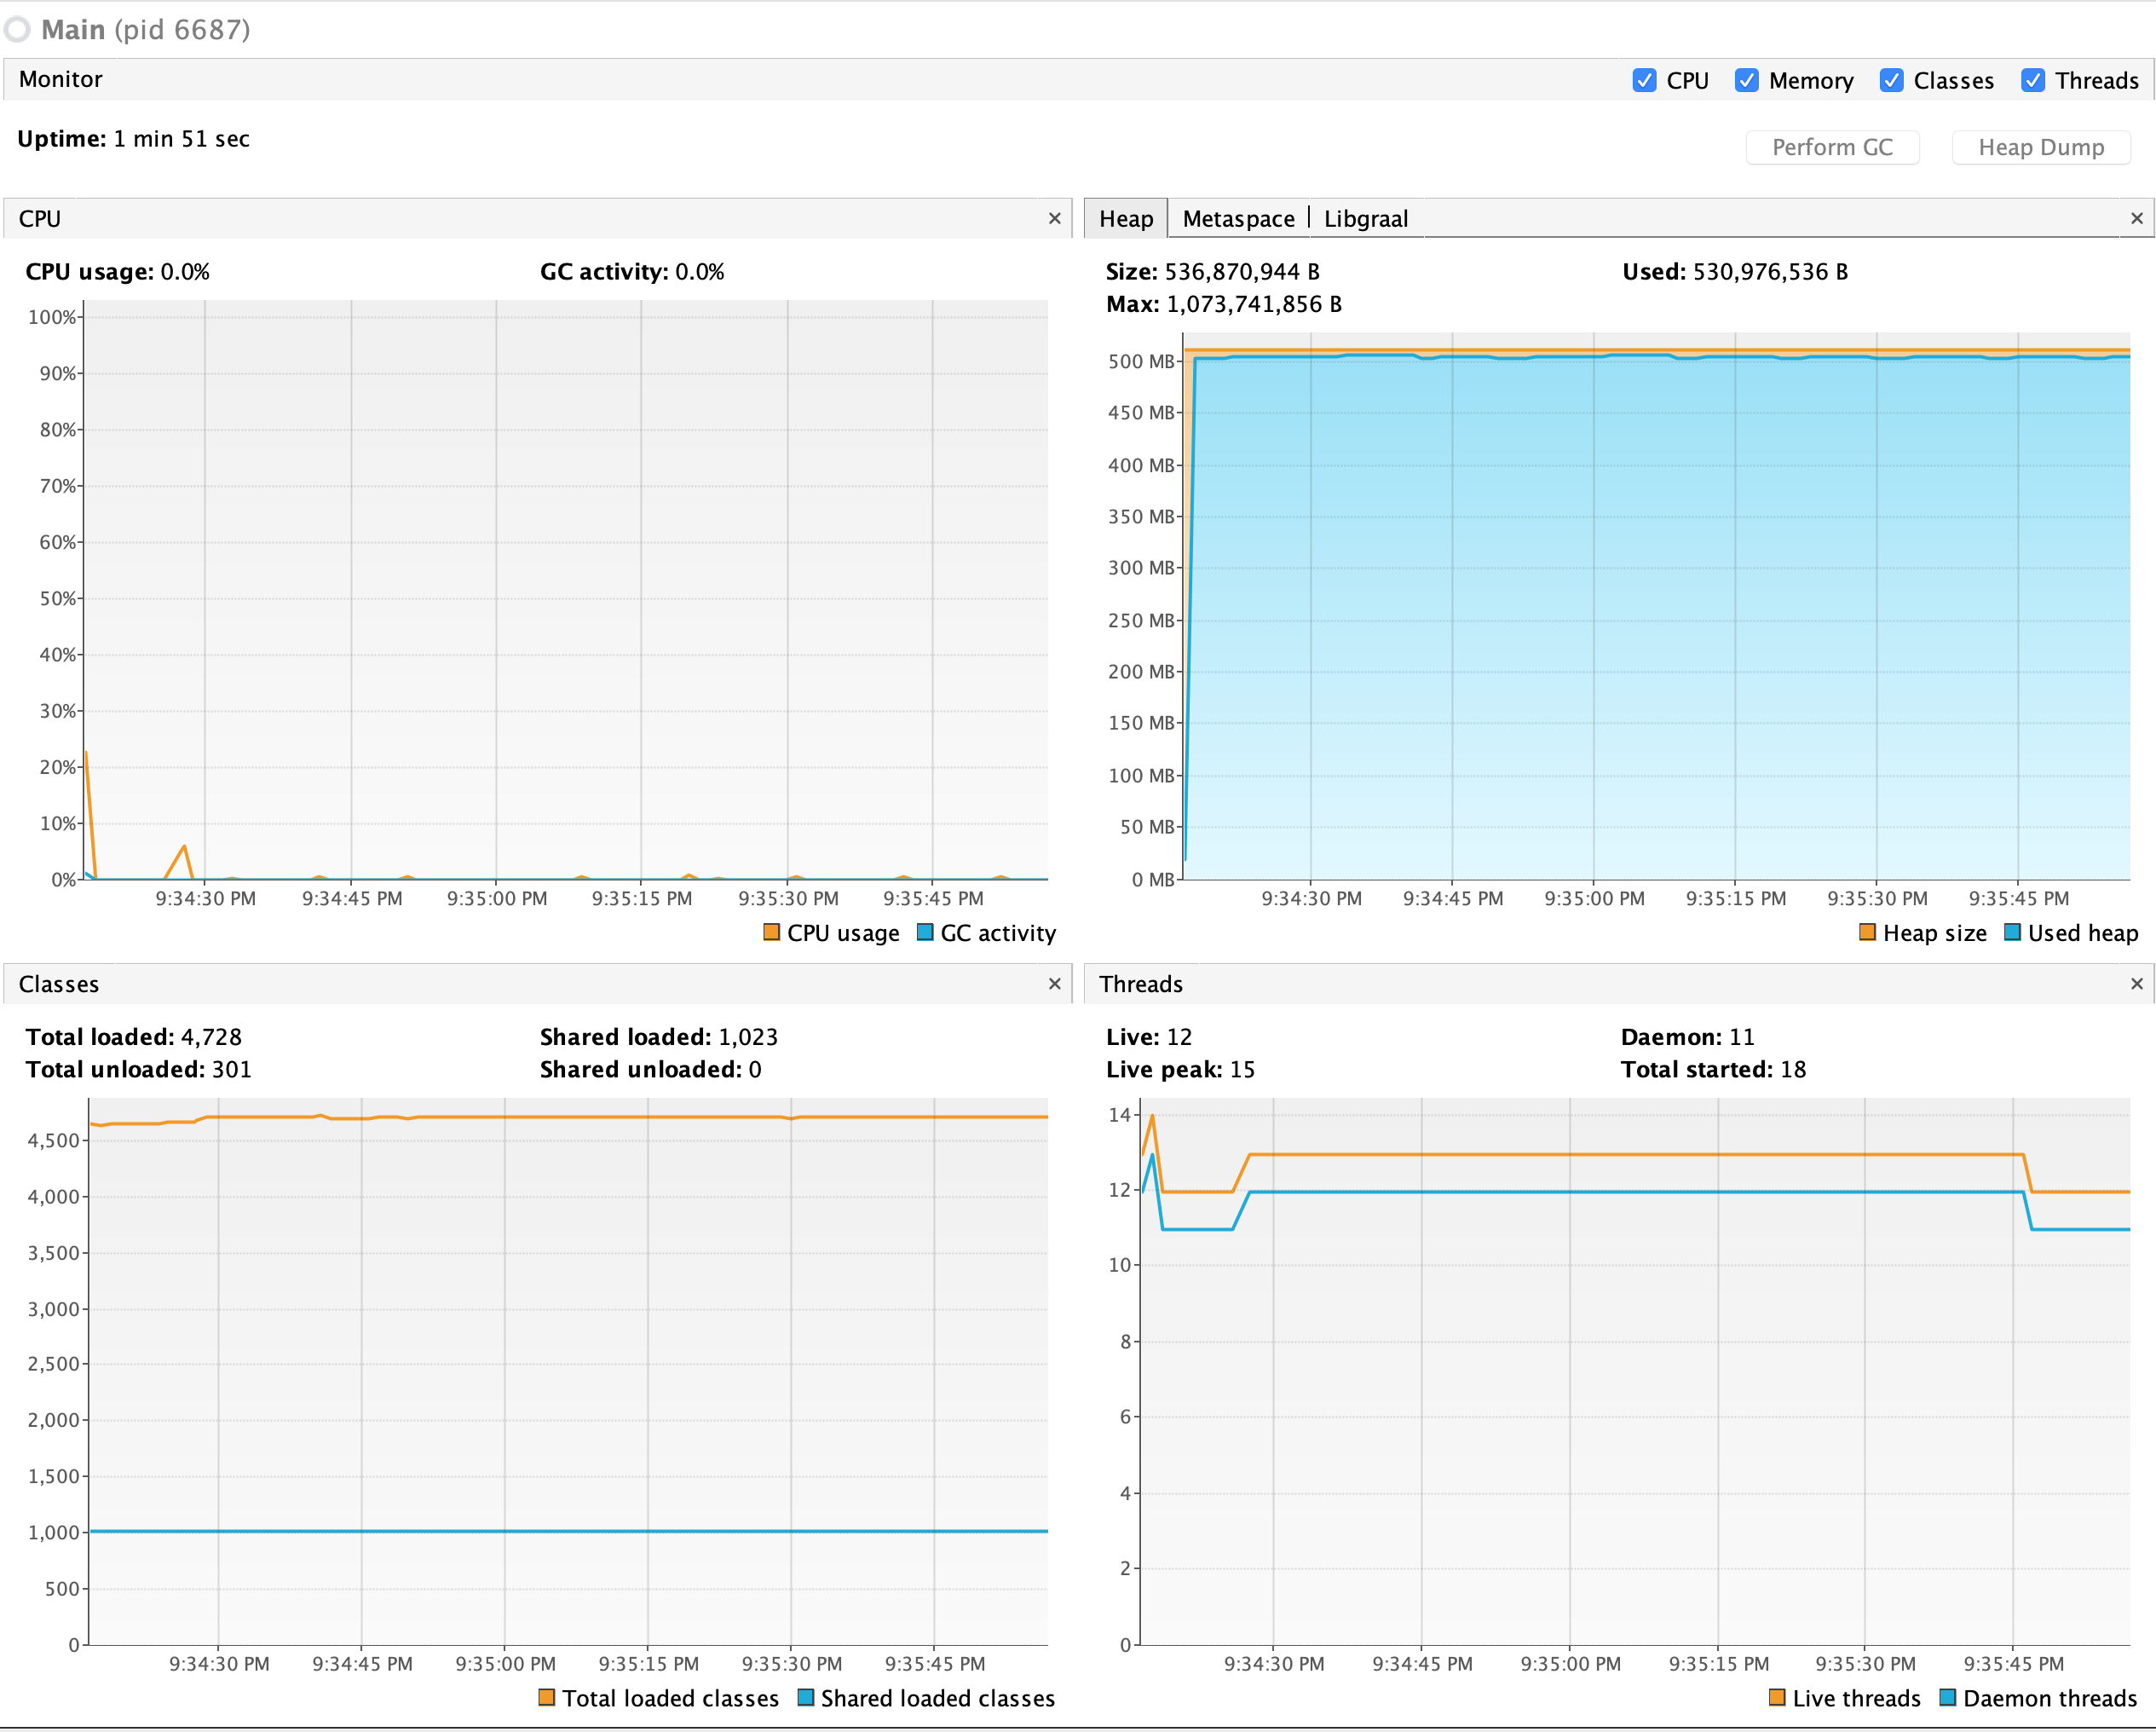
Seems to there is GraalVM/JS related memory leak. I created JS function that takes a lot of memory: // // Allocate a certain size to test if it can be done. // 'use strict'; function alloc (size) { const numbers = size / 8; const arr = [] arr.length = numbers; // Simulate allocation of 'size' bytes. for (let i = 0; i < numbers; i++) { arr[i] = i; } return arr; } // // Keep allocations referenced so they aren't garbage collected. // const allocations = []; // // Allocate successively larger sizes, doubling each time until we hit the limit. // function allocToMax () { console.log("Start"); let allocationStep = 1024 * 1024 * 5; while (true) { // Allocate memory. const allocation = alloc(allocationStep); // Allocate and keep a reference so the allocated memory isn't garbage collected. allocations.push(allocation); } } allocToMax();
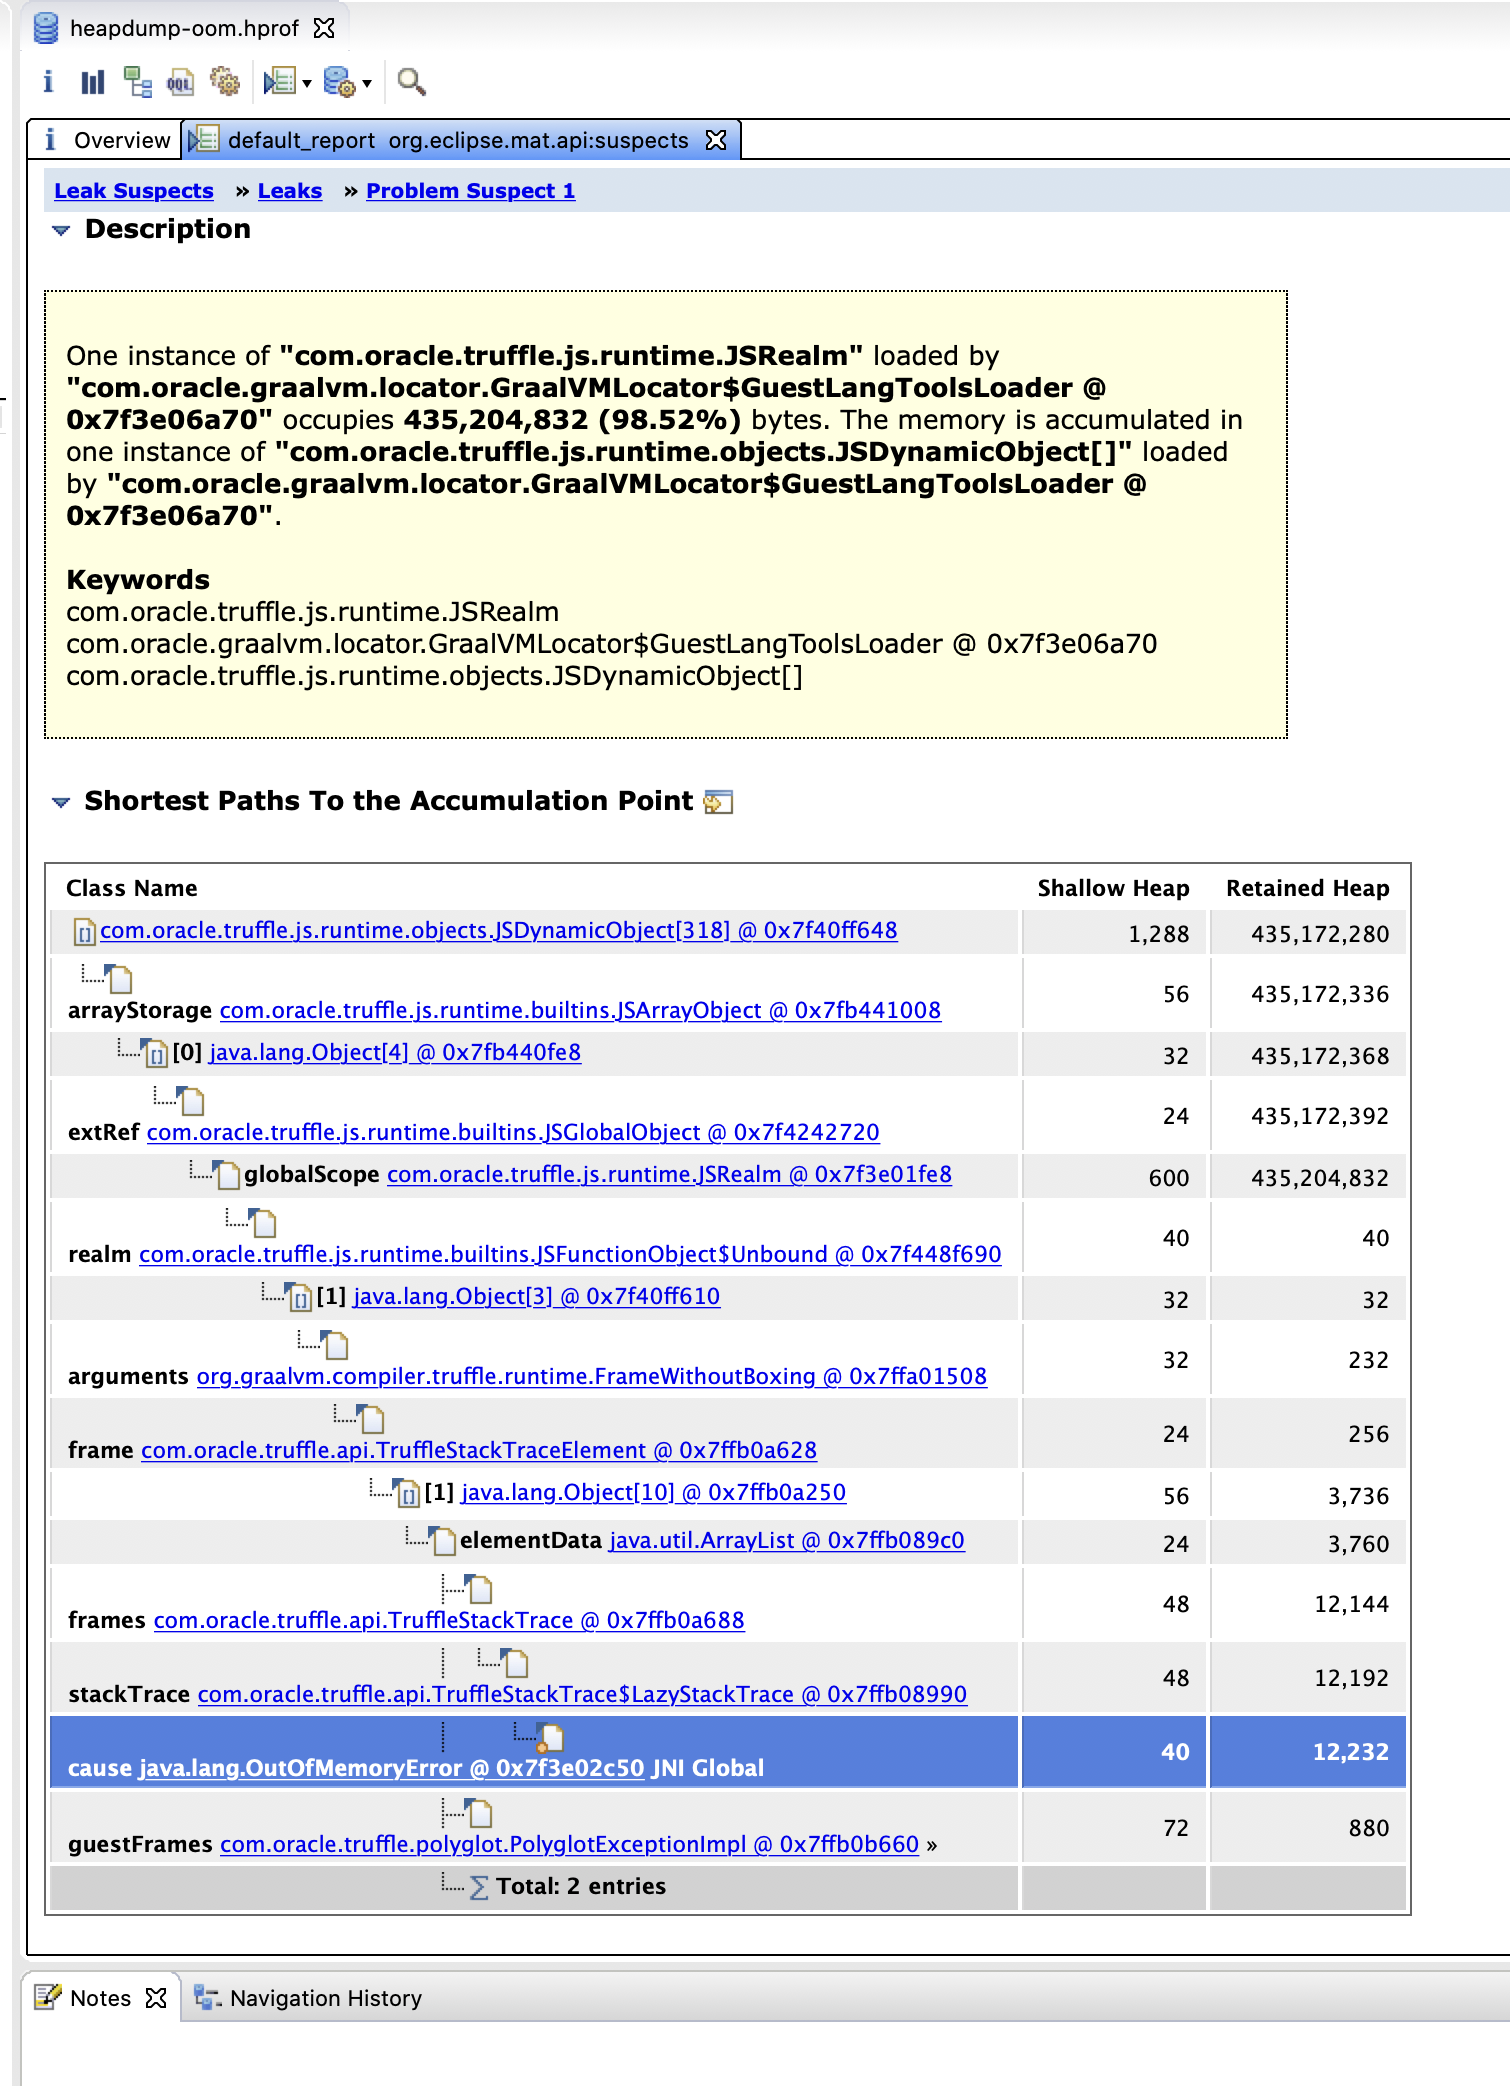
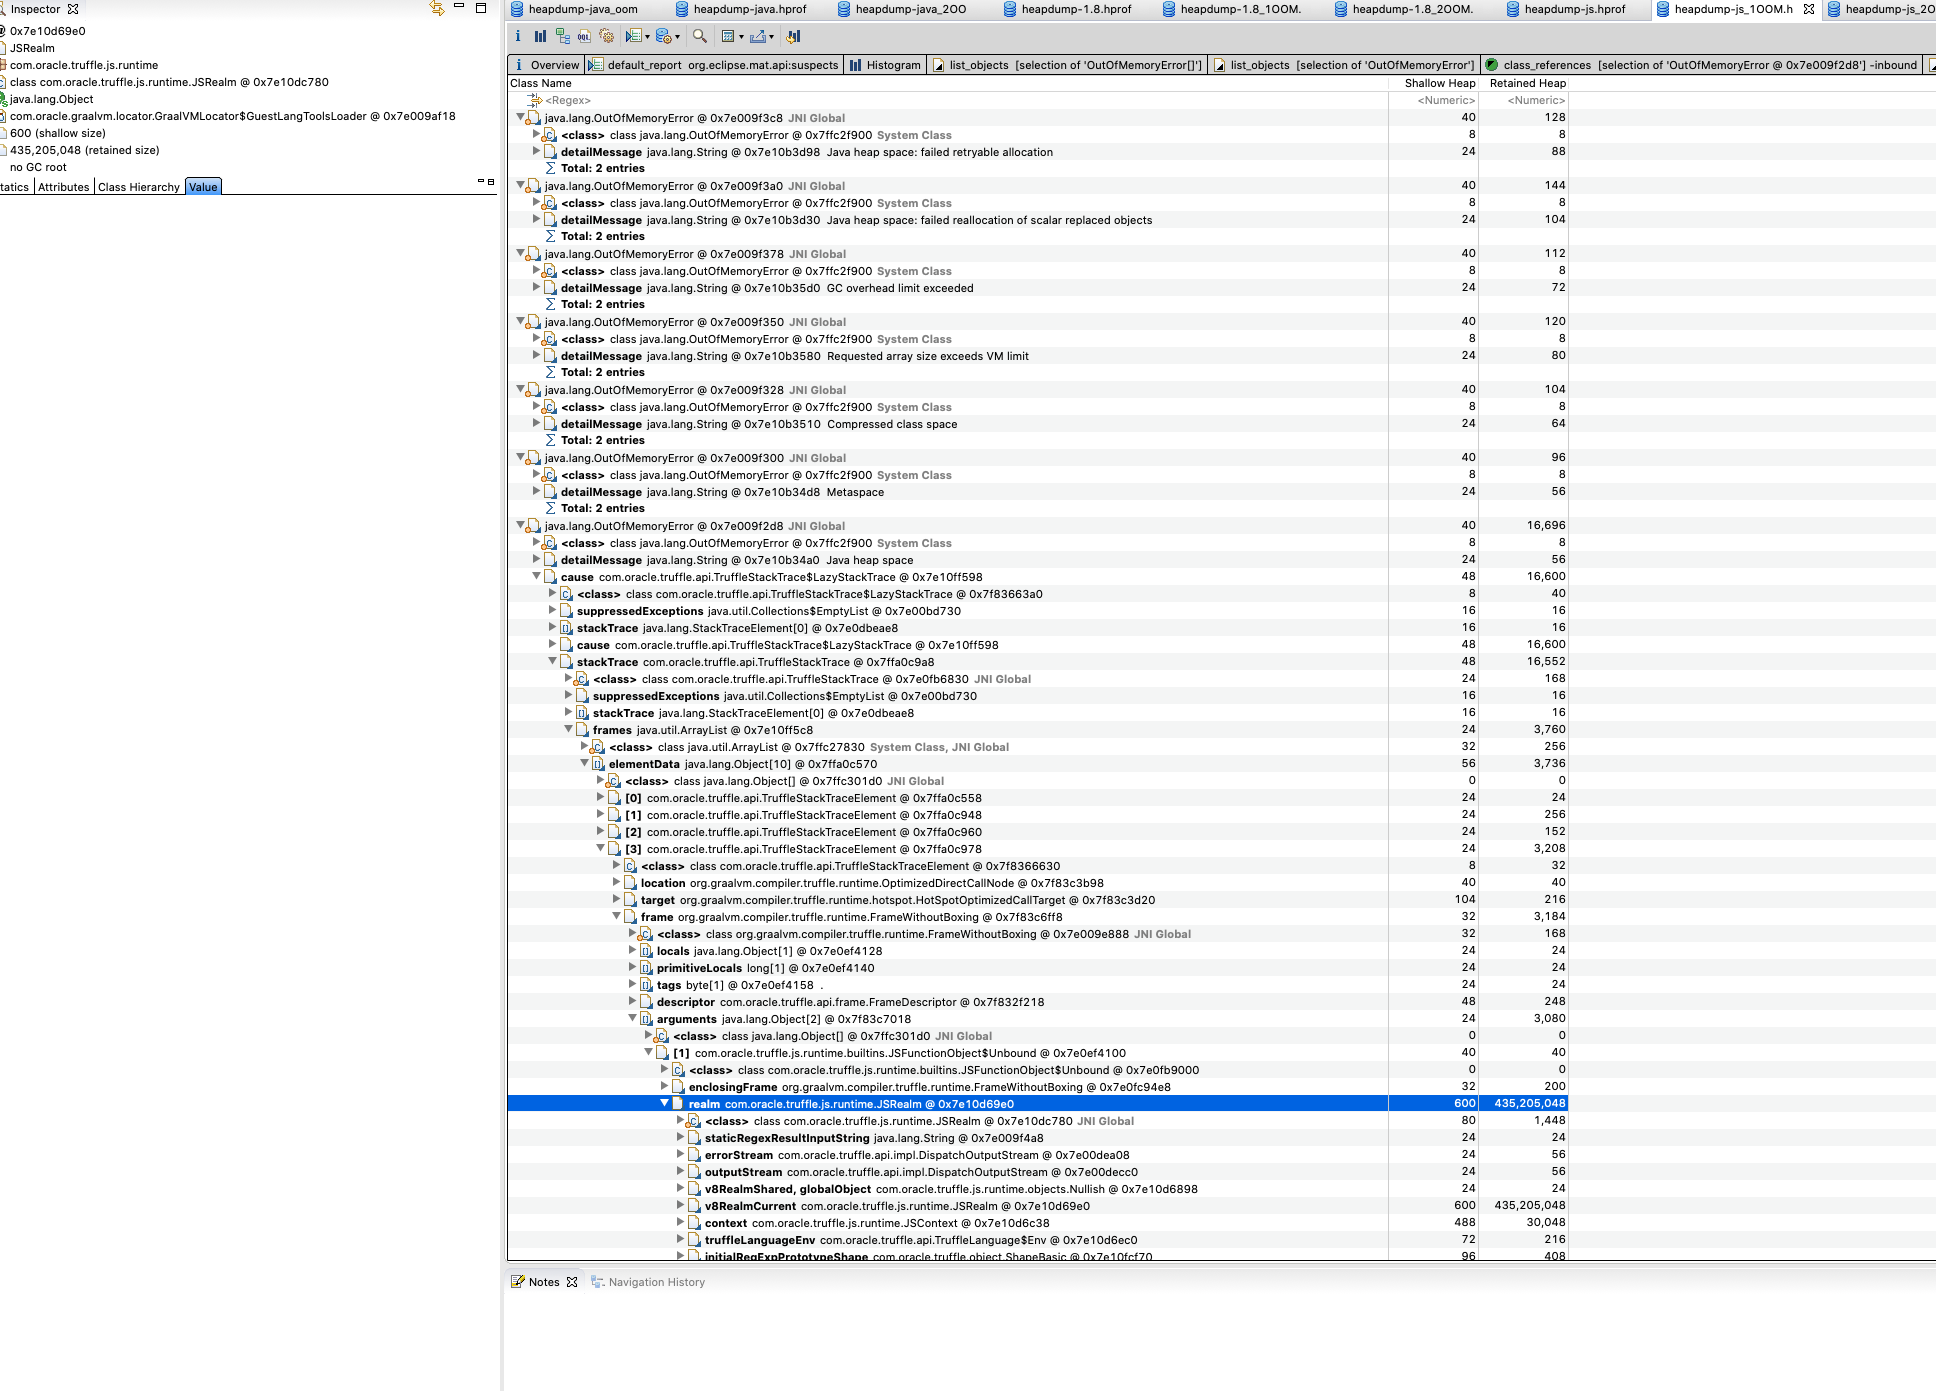
Github link with complete example: https://github.com/aliaksei-dudko/oom/blob/master/src/main/java/Main.java My expectation is that after closing the context, GС should release the memory, but when context is closed, allocated memory is still unavailable for a long time. I didn’t reproduce the case when this memory can be cleared after some time. Seems that something keeps a link on my huge array, that was created in context. After the investigation, i found out that collections of stacktrace elements(‘List<TruffleStackTraceElement> frames’) created in ‘com.oracle.truffle.api.TruffleStackTrace.fillIn(Throwable throwable){....}‘’ takes link on big object in memory(The first element of collection takes a link on huge array allocated in memory. This link exists by the scene in ‘RootCallTarget target’ inside TruffleStackTraceElement. If i set to null ‘RootCallTarget target’ for TruffleStackTraceElement, the memory is released. Also, if no elements put to collection(List<TruffleStackTraceElement> frames) memory is released. Also in ‘com.oracle.truffle.api.TruffleStackTrace.fillIn(Throwable throwable){....}’ method there is property ‘stackFrameLimit’, and if we have type of exception is TruffleException, we can customize it in graal 20.3 version, but in my case i have OOM error and by default all frames came to collection. Is this possible workaround? could you please provide any ideas of resolving this issue? Heap dump: https://drive.google.com/drive/u/0/folders/1_mdu85SaXMZbMNKX4oD-SfAEBXvaBggX

So, if I understand correctly the allocations array is leaked via the JS objects in the PolyglotException's stack trace that you're getting for an OutOfMemoryError. I'm afraid this somewhat by design. While we could clear the global scope during Context.close (maybe we should), that would not fix the problem in general since arbitrary JS objects referenced from those stack frames could retain a large amount of memory, too.
The best workaround is probably to make sure the exception is garbage collectable. Maybe try setting the exception variable null if it does not work otherwise:
} catch (Throwable e) {
    e.printStackTrace();
    e = null;
hi, @woess . Thank you for your help, yes it saves us from the problem for the example project(https://github.com/aliaksei-dudko/oom/blob/master/src/main/java/Main.java), but the problem still exists for the project with Quarkus. Seems to Error handling in quarkus takes the link to error. May be existed mechanism of setting up the count of stack trace element in graal?
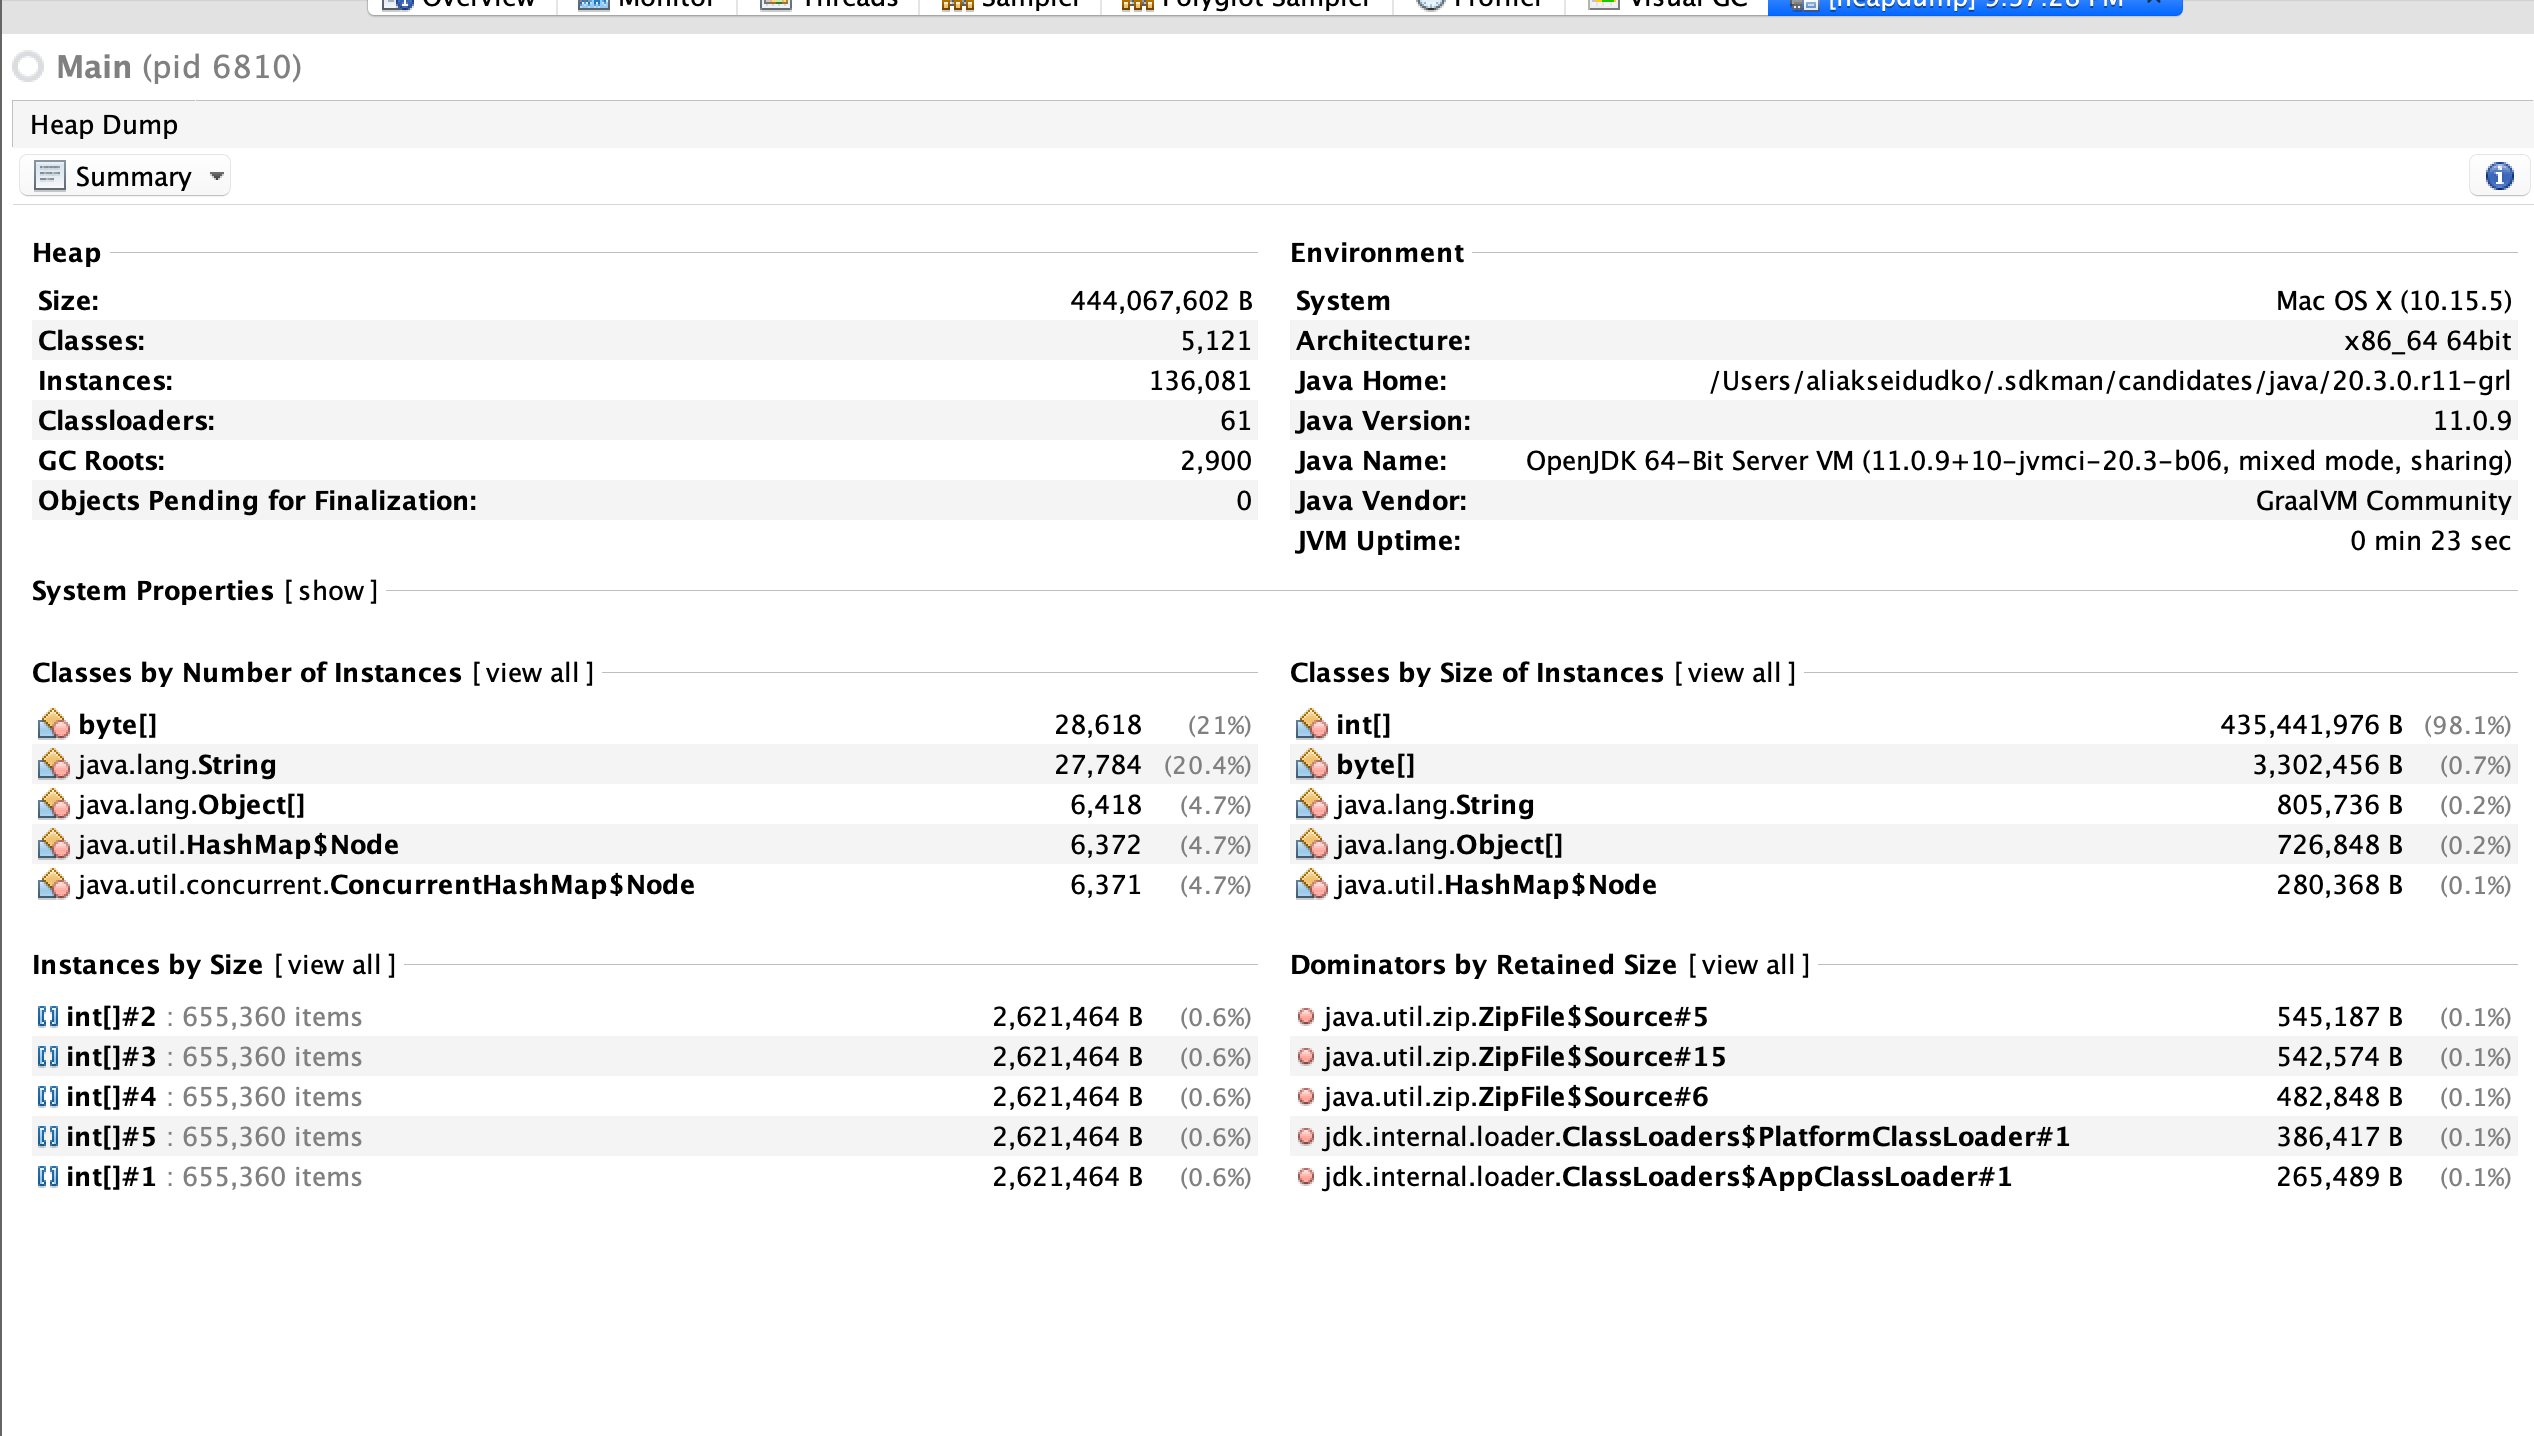
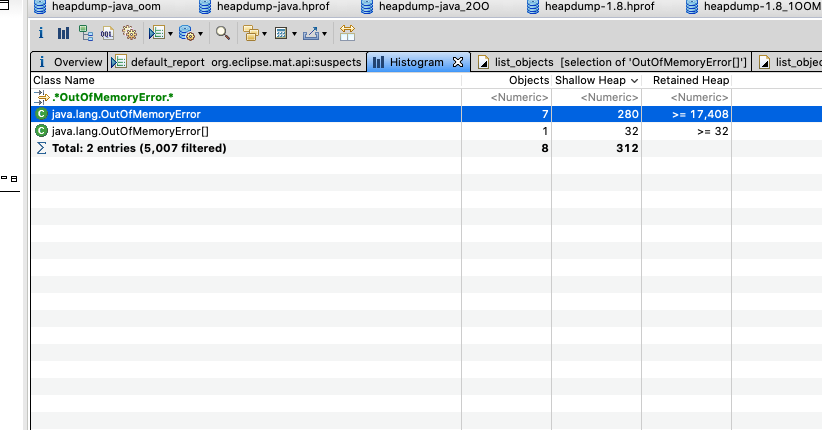
Hi, @woess , @oubidar-Abderrahim. By some reason this bug is reproduced again and setting null to OOM link does not help now. I have looked at heapdump without OOM error and found out that we have 11 prepared OOM objects at the start of application. Seven of them are JNI Global with different error messages for all cases.

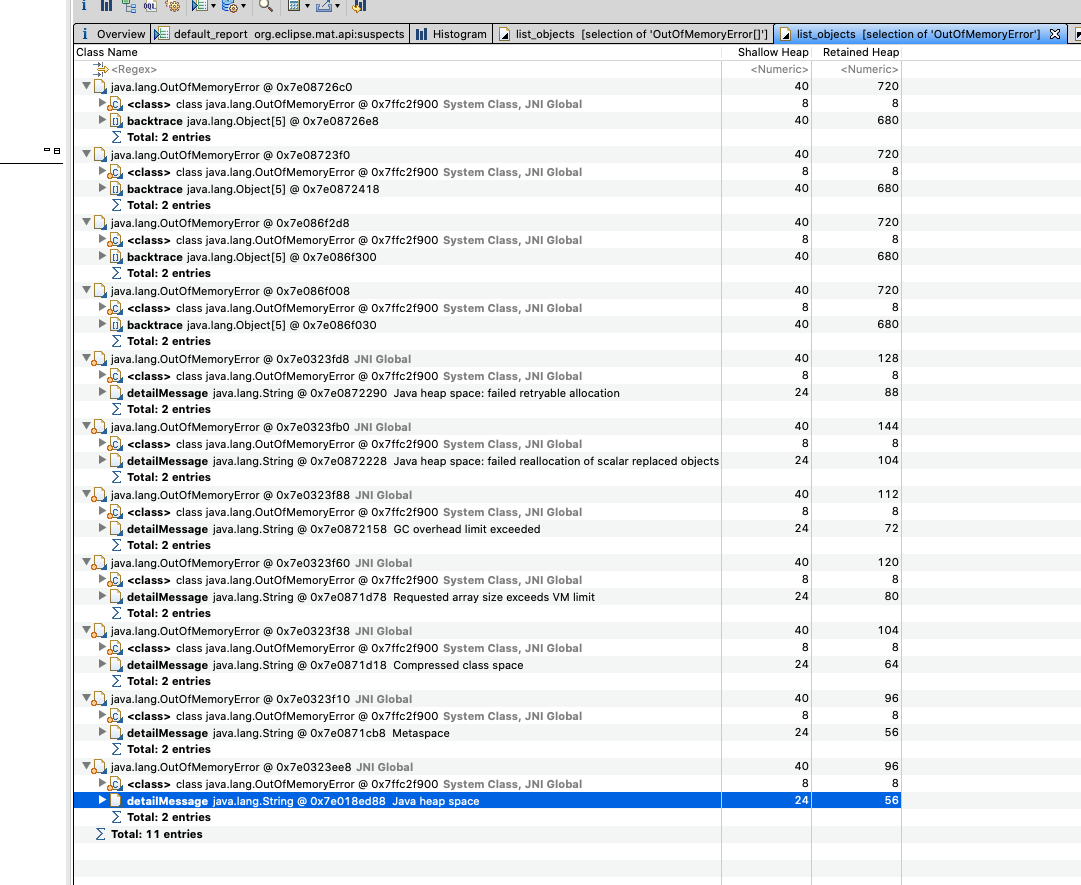
link to heapdump without OOM: https://drive.google.com/file/d/1s7hq0HivMKPvP2-Gv-d9jBp2QZrkQ98p/view?usp=sharing
If OOM happens in js context 7 prepared OOM objects are left.
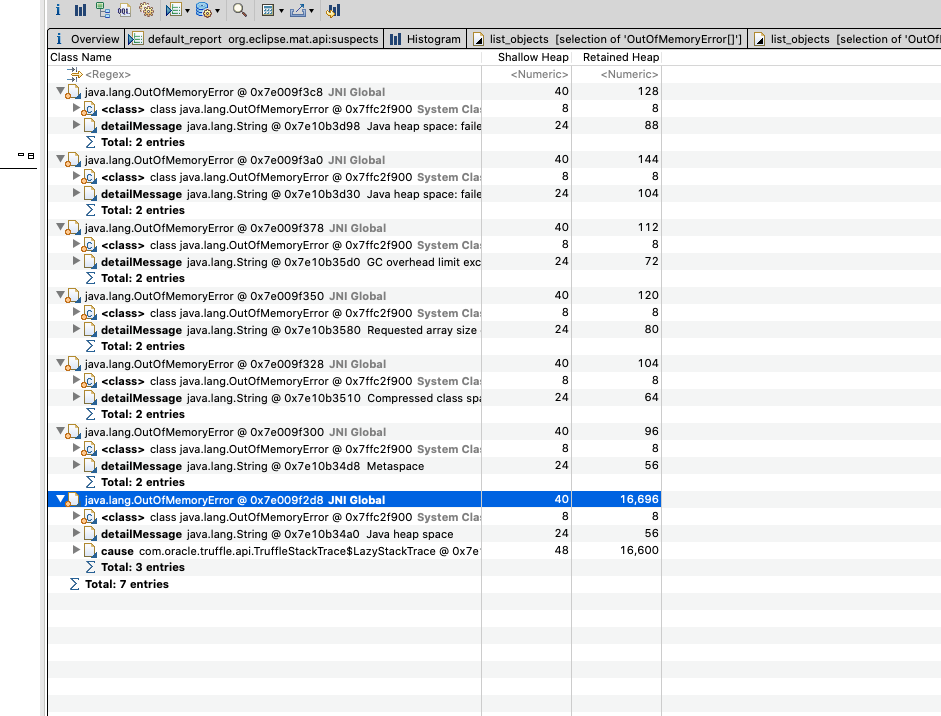
link to heapdump with OOM error happens in graal js context: https://drive.google.com/file/d/1t13UWstymo9WZeJ0KWjT8RX_YiENUqPa/view?usp=sharing
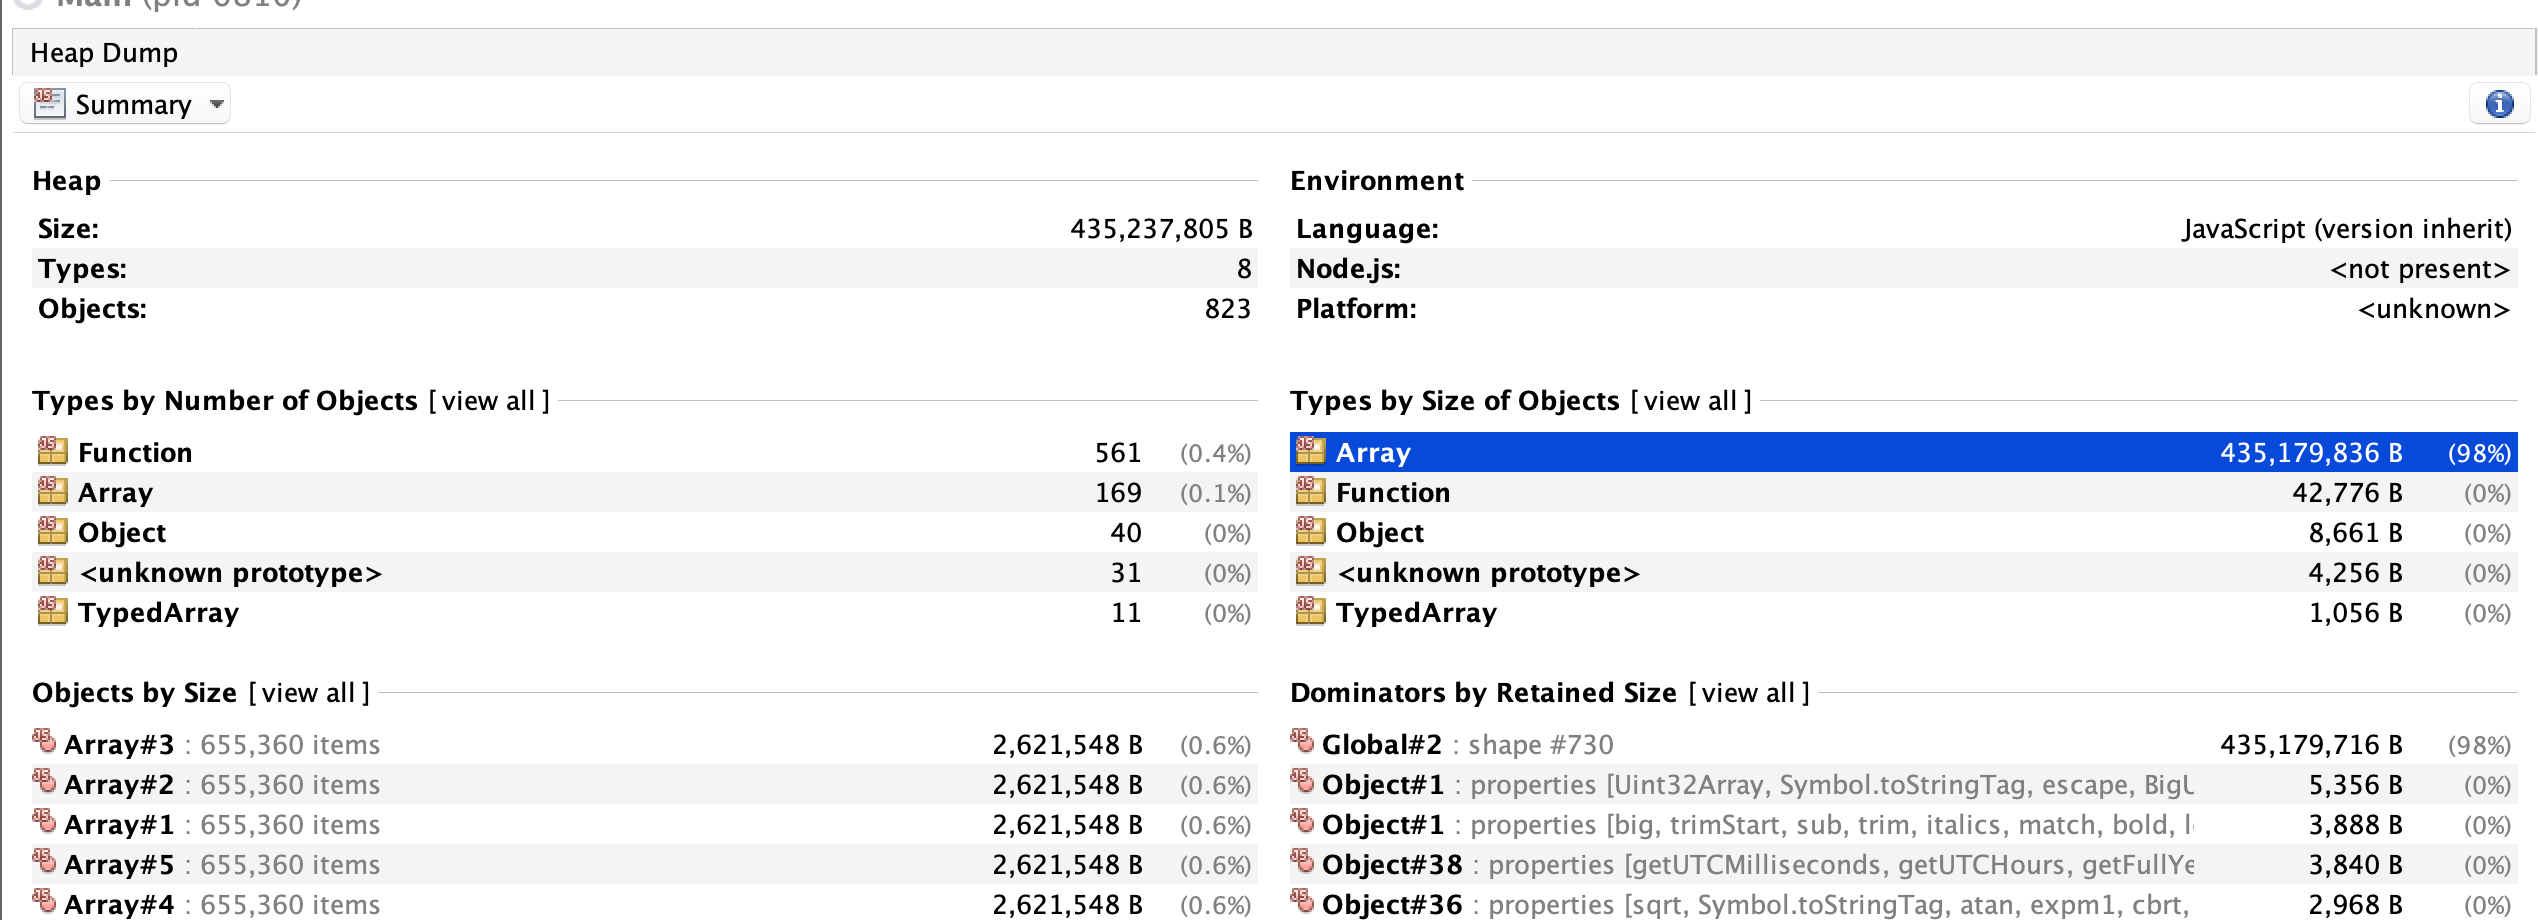
And One OOM object contains a link to a big js object that allocated all memory

I tried to reproduce OOM in graal application without js context in order to compare behavior(link to repository: https://github.com/aliaksei-dudko/oom/blob/JAVA_OOM/src/main/java/Main.java). When OOM happens in graal application we have the next picture:


link to heapdump with OOM error happened in graal app without js context: https://drive.google.com/file/d/1m7WM7gcBMgm2HnUZWU1rEJTMi1RXsefA/view?usp=sharing
In this case, we have 8 OOM objects, but no one contains a link to a big java object that allocated all memory. As I understand, this link was destroyed before OOM was thrown. I investigated more cases: 1)2, 3, 5 OOM errors in graal application without js context 2)1, 2, 5 OOM errors in java application (java 1.8) Link to object was destroyed before OOM was thrown and GC has a chance to clear heap In all cases. One difference is that with 2 and more OOM errors we have 7 OOM objects are left (the same as with js context when OOM happens).


link to heapdump with 2 OOM errors happened in graal app without js context: https://drive.google.com/file/d/1fzYopM8DJm-Y8JQx17uxHUj72KHyX1JX/view?usp=sharing
It looks like a link to big js object should be destroyed before throwing OOM error, but it does not happen and GC has no chance to clear memory. is it a bug inside graal? Do you have any ideas about how we can avoid it?
An internal tracking ticket was created for the Dev team (GR-28473)
@oubidar-Abderrahim @woess I think that the info from the link can be useful https://stackoverflow.com/questions/9261705/what-happens-when-theres-insufficient-memory-to-throw-an-outofmemoryerror So apparently the JVM makes an effort to print a stack trace if it can, but if memory is really tight, it just omits the trace, just like the other answers suggest. is it possible to omit stacktrace if memory is really tight inside GraalVM?