Object inspection in debugger is hard to work with
Using the VS Code debugger, I expanded the entry for a local variable, self, hoping to see the set of instance variables. What I got back was a long list of unsorted method names:
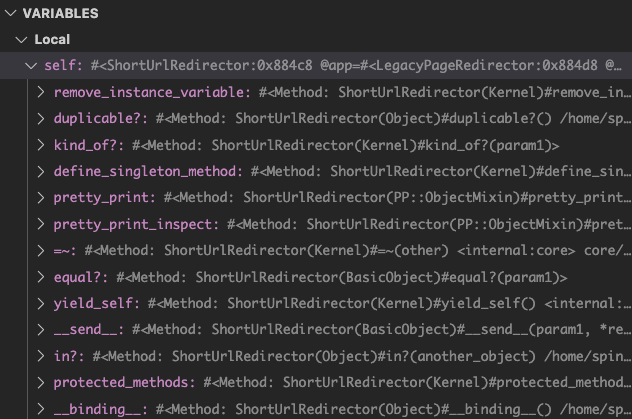
While it's helpful to see the set of methods, the list isn't sorted. As such, the list is hard to browse and to seek an individual entry. Fortunately, the IDE search function will work.
It would be good to compare to what is done for a VSCode debugger for CRuby for this.
Currently instance variables are included only if getMembers(internal=true).
Did you see ivars in your case?
Re sorting I think that could/should be handled by the GraalVM DAP backend.
It seems not from from what you say in https://github.com/oracle/truffleruby/issues/2727#issue-1368191710.
So I think this is tooling issue:
- Sort members for the variables view (or if the language should do that, specify that, but that seems too expensive for general
getMembers()) - Call
getMembers(internal=true)and not justgetMembers() - Maybe we should not show invocable members (i.e., methods). Although, if they are listed at the end due to sorting and
@coming first it may be not so much of an issue. I think we should do the same as VSCode debuggers for CRuby here (which I'm not sure what it is).