ZFS seems to wear out disk - tremedously poor performance and high 4k I/O mostly on two (of eight) disks
System information
| Type | Version/Name |
|---|---|
| Distribution Name | linux openSuSE |
| Distribution Version | Leap 15.1 |
| Kernel Version | 4.12.14-lp151.28.91-default #1 SM |
| Architecture | amd64 |
| OpenZFS Version | 0.8.5-1 |
Describe the problem you're observing
I'm seeing absolutely horrendous performance (often below 100 KB/sec) on an encrypted raid-z3 (8 partitions/8 disks) with dedup. (Yes, I've read warnings on dedup and yes, I've probably chosen what is not recommended, but this seems quite several magnitudes worse than it probably should be).
Obviously VM runs very poorly but also file access (via SAMBA) starts to degrade extremely fast - writing a single small file of about 4 MB is ok, writing several brings performance down. A local rsync yielded 2,4 MB/sec on 180 GB of data.
Analysis seems to indicate a "4k access problem": Pool was created with ashift=12 and recordsize is 128k yet there are extremely high numbers of 4k accesses which cluster on only two disks and thus very often max them out. This is somewhat confirmed by
# zpool iostat -vr tank_01 2 | egrep "sync_read|req|^4K|^--" | awk '{ if ( $1 ~ "wwn-.*part1" ) { print gensub("wwn-.*part1", "wwn-disk-" ++nr "-part1", "g", $0) } else { print $0 } }'
tank_01                             sync_read    sync_write    async_read    async_write      scrub         trim
req_size                            ind    agg    ind    agg    ind    agg    ind    agg    ind    agg    ind    agg
--------------------------------  -----  -----  -----  -----  -----  -----  -----  -----  -----  -----  -----  -----
4K                                 271M      0  7.12M      0  57.2M      0  1.15G      0    439      0      0      0
--------------------------------------------------------------------------------------------------------------------
raidz3                              sync_read    sync_write    async_read    async_write      scrub         trim
req_size                            ind    agg    ind    agg    ind    agg    ind    agg    ind    agg    ind    agg
--------------------------------  -----  -----  -----  -----  -----  -----  -----  -----  -----  -----  -----  -----
4K                                 271M      0  7.03M      0  57.2M      0  1.15G      0    439      0      0      0
--------------------------------------------------------------------------------------------------------------------
wwn-disk-1-part1                    sync_read    sync_write    async_read    async_write      scrub         trim
req_size                            ind    agg    ind    agg    ind    agg    ind    agg    ind    agg    ind    agg
--------------------------------  -----  -----  -----  -----  -----  -----  -----  -----  -----  -----  -----  -----
4K                                5.27M      0   900K      0   283K      0   139M      0     30      0      0      0
--------------------------------------------------------------------------------------------------------------------
wwn-disk-2-part1                    sync_read    sync_write    async_read    async_write      scrub         trim
req_size                            ind    agg    ind    agg    ind    agg    ind    agg    ind    agg    ind    agg
--------------------------------  -----  -----  -----  -----  -----  -----  -----  -----  -----  -----  -----  -----
4K                                4.87M      0   900K      0   185K      0   135M      0     18      0      0      0
--------------------------------------------------------------------------------------------------------------------
wwn-disk-3-part1                    sync_read    sync_write    async_read    async_write      scrub         trim
req_size                            ind    agg    ind    agg    ind    agg    ind    agg    ind    agg    ind    agg
--------------------------------  -----  -----  -----  -----  -----  -----  -----  -----  -----  -----  -----  -----
4K                                6.01M      0   900K      0  19.0M      0   153M      0     60      0      0      0
--------------------------------------------------------------------------------------------------------------------
wwn-disk-4-part1                    sync_read    sync_write    async_read    async_write      scrub         trim
req_size                            ind    agg    ind    agg    ind    agg    ind    agg    ind    agg    ind    agg
--------------------------------  -----  -----  -----  -----  -----  -----  -----  -----  -----  -----  -----  -----
4K                                 119M      0   900K      0  9.10M      0   140M      0    168      0      0      0
--------------------------------------------------------------------------------------------------------------------
wwn-disk-5-part1                    sync_read    sync_write    async_read    async_write      scrub         trim
req_size                            ind    agg    ind    agg    ind    agg    ind    agg    ind    agg    ind    agg
--------------------------------  -----  -----  -----  -----  -----  -----  -----  -----  -----  -----  -----  -----
4K                                5.21M      0   900K      0   373K      0   160M      0     15      0      0      0
--------------------------------------------------------------------------------------------------------------------
wwn-disk-6-part1                    sync_read    sync_write    async_read    async_write      scrub         trim
req_size                            ind    agg    ind    agg    ind    agg    ind    agg    ind    agg    ind    agg
--------------------------------  -----  -----  -----  -----  -----  -----  -----  -----  -----  -----  -----  -----
4K                                4.78M      0   900K      0   167K      0   157M      0     49      0      0      0
--------------------------------------------------------------------------------------------------------------------
wwn-disk-7-part1                    sync_read    sync_write    async_read    async_write      scrub         trim
req_size                            ind    agg    ind    agg    ind    agg    ind    agg    ind    agg    ind    agg
--------------------------------  -----  -----  -----  -----  -----  -----  -----  -----  -----  -----  -----  -----
4K                                6.91M      0   900K      0  19.0M      0   153M      0     70      0      0      0
--------------------------------------------------------------------------------------------------------------------
wwn-disk-8-part1                    sync_read    sync_write    async_read    async_write      scrub         trim
req_size                            ind    agg    ind    agg    ind    agg    ind    agg    ind    agg    ind    agg
--------------------------------  -----  -----  -----  -----  -----  -----  -----  -----  -----  -----  -----  -----
4K                                 120M      0   900K      0  9.14M      0   140M      0     29      0      0      0
--------------------------------------------------------------------------------------------------------------------
The output seems to confirm an extraordinary number of ~ 120M 4k reads on disks 4 and 8 vs. about 6 M reads on other drives. It also shows a majority of reads is 4k:
# zpool iostat -vr tank_01

tank_01                             sync_read    sync_write    async_read    async_write      scrub         trim
req_size                            ind    agg    ind    agg    ind    agg    ind    agg    ind    agg    ind    agg
--------------------------------  -----  -----  -----  -----  -----  -----  -----  -----  -----  -----  -----  -----
512                                   0      0      0      0      0      0      0      0      0      0      0      0
1K                                    0      0      0      0      0      0      0      0      0      0      0      0
2K                                    0      0      0      0      0      0      0      0      0      0      0      0
4K                                 272M      0  7.12M      0  57.2M      0  1.15G      0    439      0      0      0
8K                                19.0M   142K  3.34K      0  91.4M  1.50M  91.8M   318M      1    105      0      0
16K                               8.59M   179K  1.70M    971  52.3M  5.90M  49.9M   179M      1     85      0      0
32K                                   0   128K  30.6K  2.31K      0  7.70M      0   122M      0    102      0      0
64K                                  40  29.1K  47.5K  1.96K      5  6.28M      0  52.5M      0     69      0      0
128K                                 15  15.7K  1.15M  4.14K      0  4.35M  17.1M  11.1M      0     15      0      0
256K                                  0  4.83K      0  3.72K      0  2.10M      0  2.05M      0      0      0      0
512K                                  0  3.88K      0  3.30K      0  1.46M      0   403K      0      0      0      0
1M                                    0  1.01K      0      0      0   191K      0  33.3K      0      0      0      0
2M                                    0      0      0      0      0      0      0      0      0      0      0      0
4M                                    0      0      0      0      0      0      0      0      0      0      0      0
8M                                    0      0      0      0      0      0      0      0      0      0      0      0
16M                                   0      0      0      0      0      0      0      0      0      0      0      0
--------------------------------------------------------------------------------------------------------------------
Describe how to reproduce the problem
The system had 16 GB RAM which have been increased to 48 GB (with no change what so ever). CPU was a Intel i3-8100 and is now i3-9100. It otherwise only runs one (kvm) VM (image is a (raw) file on tank_01).
As it has been about a year of try and error and also several zfs versions (encryption optimizations!) exact history is somewhat difficult to guarantee. I started out creating the pool along the line
zpool create -o ashift=12 -o feature@encryption=enabled -O encryption=on -O keyformat=raw -O keylocation=file:///etc/zfs.key -m /media/zfs/tank_01 -o autoexpand=on -O dedup=sha256,verify -O checksum=sha256 -O recordsize=32k tank_01 raidz3 ...
Datasets have been created as clones to a "master" dataset (because of otherwise unusable dedup). Original dataset has been replaced with another (to change encryption to speedier aes-256-gcm and recordsize to 128k), but performance has not improved significantly.
Did add a mirror of two nvme as log device, but no significant change, either.
Include any warning/errors/backtraces from the system logs
Converting a 320 GB image via qemu-img took about 30h roughly an average of about 3 MB/sec.
/proc/spl/kstat/zfs/dbgmsg contains
1631126526   zio.c:1969:zio_deadman(): zio_wait waiting for hung I/O to pool 'tank_01'
1631126588   zio.c:1969:zio_deadman(): zio_wait waiting for hung I/O to pool 'tank_01'
May be related to #9130 as txg_sync can take long and will effectively stop all other io. Obviously when overwriting data I'm also hit by too many free tasks (#3976), but for me it seems a bit of a side issue. I may modify spa.c to limit this somewhat.
In another issue I found a convenient smart report which seems relevant:
ZPOOL_SCRIPTS_AS_ROOT=1 zpool iostat -c smart
                                    capacity     operations     bandwidth
pool                              alloc   free   read  write   read  write  health  realloc  rep_ucor      cmd_to  temp  pend_sec  off_ucor  ata_err  nvme_err
--------------------------------  -----  -----  -----  -----  -----  -----  ------  -------  --------  ----------  ----  --------  --------  -------  --------
tank_01                           21.2T  33.1T      2     53  16.3K   617K
  raidz3                          21.2T  33.1T      2     53  16.3K   576K
    wwn-disk-1-part1                  -      -      0      7  1.03K  78.6K  PASSED        0         0           0    48         0         0        -         -
    wwn-disk-2-part1                  -      -      0      6    949  70.5K  PASSED        0         0           0    47         0         0        -         -
    wwn-disk-3-part1                  -      -      0      6    930  70.0K  PASSED        0         0           0    46         0         0        -         -
    wwn-disk-4-part1                  -      -      0      6  5.31K  69.7K  PASSED        0         0  4295032833    47         0         0        -         -
    wwn-disk-5-part1                  -      -      0      7  1.04K  78.6K  PASSED        0         0           0    48         0         0        -         -
    wwn-disk-6-part1                  -      -      0      6    971  69.9K  PASSED        0         0           0    48         0         0        -         -
    wwn-disk-7-part1                  -      -      0      6    954  69.5K  PASSED        0         0           0    48         0         0        -         -
    wwn-disk-8-part1                  -      -      0      6  5.24K  69.2K  PASSED        0         0  4295032833    48         0         0        -         -
logs                                  -      -      -      -      -      -
  mirror                           512K  15.5G      0      0      1  41.5K
    nvme0n1p5                         -      -      0      0      0  20.8K  PASSED        -         -           -    49         -         -        -         5
    nvme1n1p5                         -      -      0      0      0  20.8K  PASSED        -         -           -    45         -         -        -         2
--------------------------------  -----  -----  -----  -----  -----  -----  ------  -------  --------  ----------  ----  --------  --------  -------  --------
So it seems these two disks have an issue, whether as cause or effect I can't tell.
What made/model are those disks and are they all the same? (not the nvme). You can grab the same counters from smartctl.
Actually there are two different models (ST8.000NM0.105-1VS112, ST8.000VX0.022-2EJ112) involved, but disks 3 to 8 are the same (ST8.000VX0.022-2EJ112). In the list above the command timeout counter is extraordinary high just for disks 4 and 8. These are the very same disks which have about 30 times more 4k reads as the other disks. Now what I'd really like to get a grip on is why it had these massive amounts of 4k reads in the first place: Even if data is compressible it seems not likely to be compressible down to 4k. And it also seems unlikely deduplication kicking in and even if reads should again be larger than 4k. So what could be wrong? Could encryption cause these small reads? But why only on two disks? I just can't figure it out on my own, any help is most appreciated. Amendment: Obviously recordsized data still needs to be distributed over the disks (and parity generated). In my case it would be 128k / (8-3) disks ~ 26k per disk (and lower with compression) maybe even split in ashift (=4K) sized quantities if not aggregated within / beyond records.
Assuming the reported values from Smart are accurate I'd say you should start there. Confirm the state of those two drives or take them out of the pool entirely. You can try something like ioping against the device itself and a mounted path to compare at least if it's the drives but FWIW you shouldn't expect much performance from the Skyhawks given they are targeted at a very specific market - dvr. ie write heavy.
I've chosen SkyHawks because they are CMR, without helium, according to specs good for 7x24 and 180 TB/year. Even if they aren't top notch performance drives they should do better then 2,4 MB/sec writing.
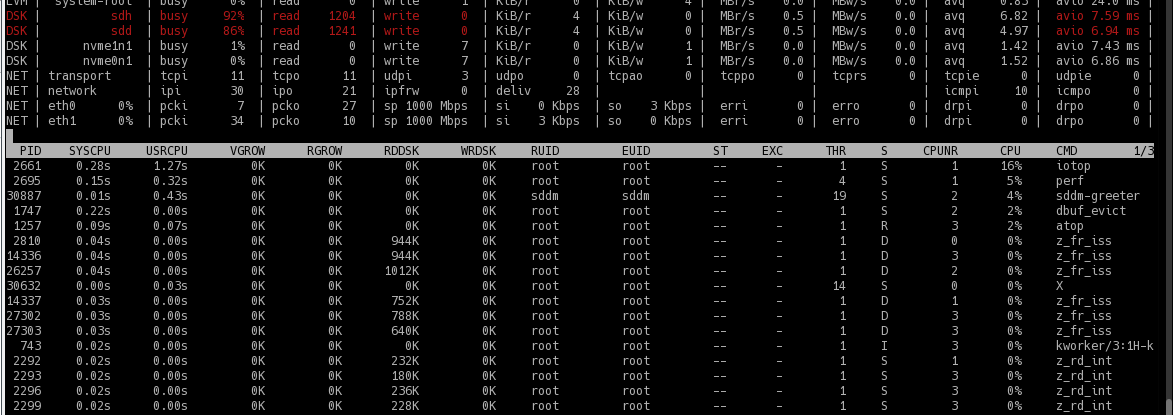
I've exported the pool and copied all data from wwn-disk-4-part1 to a new disk. Copying went fine, well above 100 MB/s so sequential read is fine. I've removed wwn-disk-4-part1 and the pool accepted the "mirrored" disk without fuss. Now I have these mysterious reads during writing on the replacement disk. atop shows them as
...
MEM | tot    47.0G | free   42.7G  | cache 838.6M | buff    5.9M | slab  696.1M  | shmem  15.1M | vmbal   0.0M | hptot   0.0M  | hpuse   0.0M |
|
DSK |          sdg | busy     76%  | read     713 | write    269 | KiB/r      4  | KiB/w     28 | MBr/s    0.3 | MBw/s    0.7  | avio 7.78 ms |
DSK |          sdh | busy     75%  | read     705 | write    269 | KiB/r      4  | KiB/w     24 | MBr/s    0.3 | MBw/s    0.6  | avio 7.66 ms |
DSK |          sdb | busy     13%  | read       0 | write    269 | KiB/r      0  | KiB/w     24 | MBr/s    0.0 | MBw/s    0.6  | avio 4.67 ms |
DSK |          sdc | busy     12%  | read       0 | write    269 | KiB/r      0  | KiB/w     24 | MBr/s    0.0 | MBw/s    0.6  | avio 4.46 ms |
DSK |          sda | busy     12%  | read       0 | write    269 | KiB/r      0  | KiB/w     28 | MBr/s    0.0 | MBw/s    0.7  | avio 4.33 ms |
DSK |          sde | busy     12%  | read       0 | write    269 | KiB/r      0  | KiB/w     28 | MBr/s    0.0 | MBw/s    0.7  | avio 4.30 ms |
DSK |          sdf | busy     12%  | read       0 | write    269 | KiB/r      0  | KiB/w     28 | MBr/s    0.0 | MBw/s    0.7  | avio 4.28 ms |
DSK |          sdd | busy     11%  | read       0 | write    268 | KiB/r      0  | KiB/w     28 | MBr/s    0.0 | MBw/s    0.7  | avio 4.04 ms |
Disks generally don't do well on 4k (non sequential) reads, so I'm probably back to square one as I'd guess it's not the disks.
Issue #2885 also seems related: Larger amounts of data bring write performance down, which is what happens in my case due to the small reads, too.
I just found https://openzfs.org/w/images/8/8d/ZFS_dedup.pdf from Matt Ahrens. The mentioned git https://github.com/ahrens/illumos/tree/dedup seems older, but I'm not sure his suggested improvements made it to openzfs yet.
According to the slides every write generates to roughly 5 writes and may generate random reads if DDT got evicted. As the issue is much more pronounced with bigger data maybe the ddt gets evicted in my case thus leading to 4k random reads. That would at least be a plausible theory, even if it does not explain why certain disks seem to get more of these small reads.
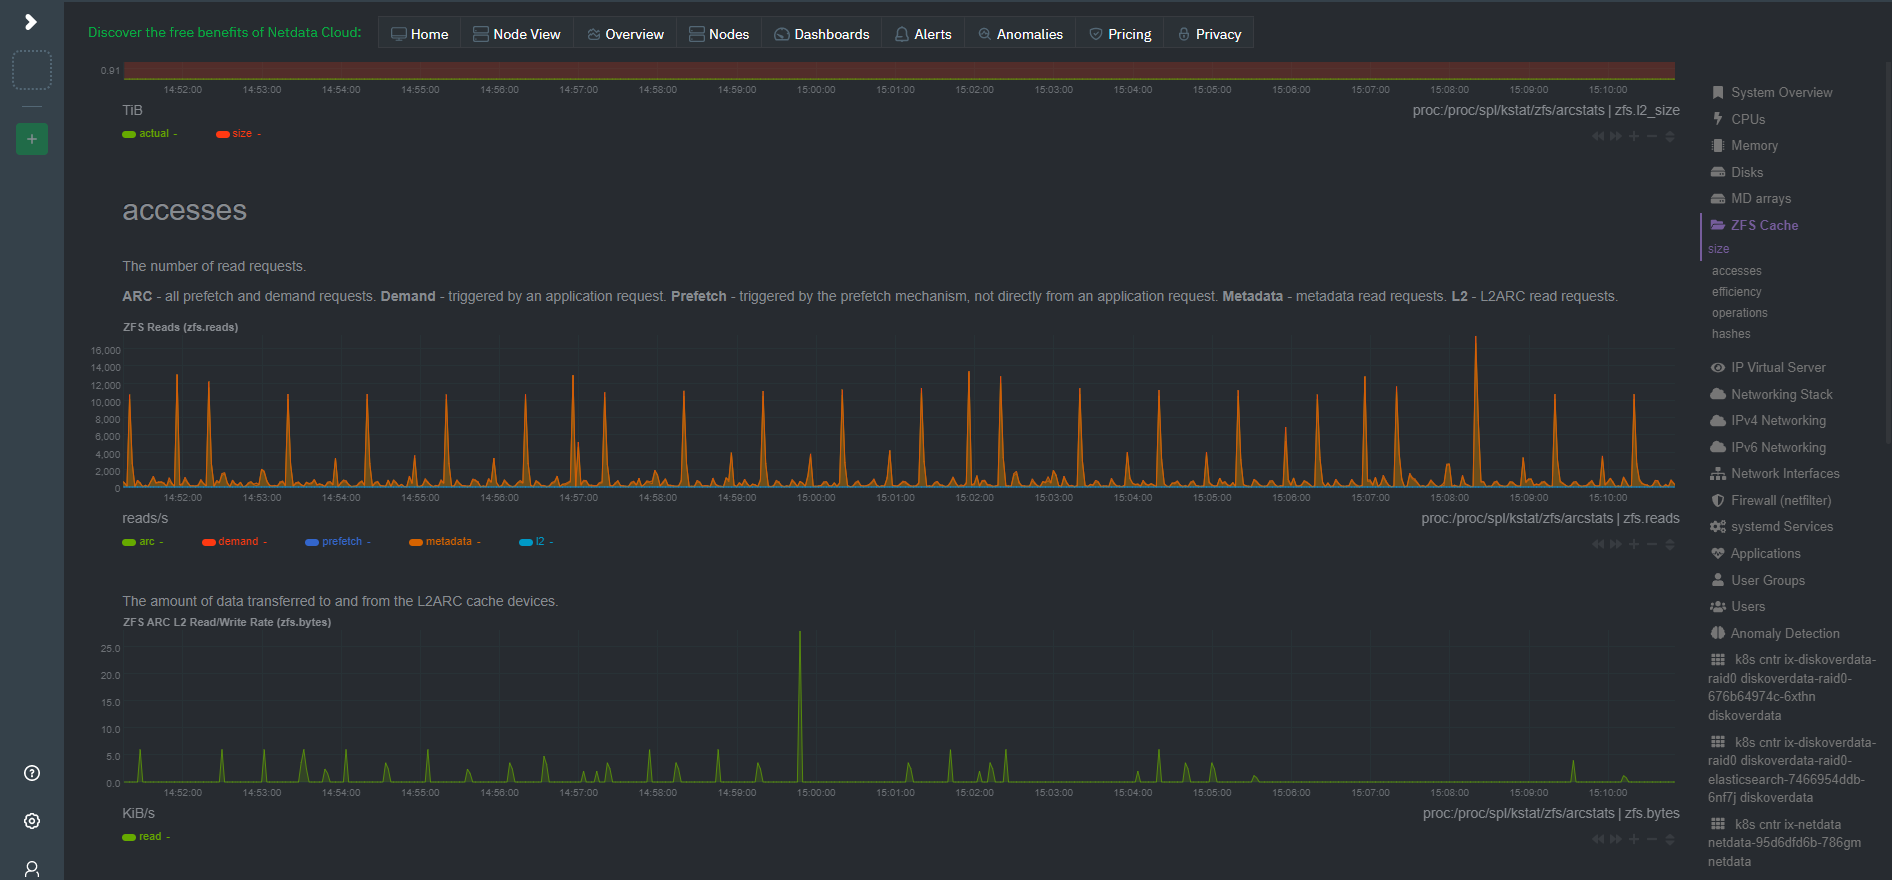
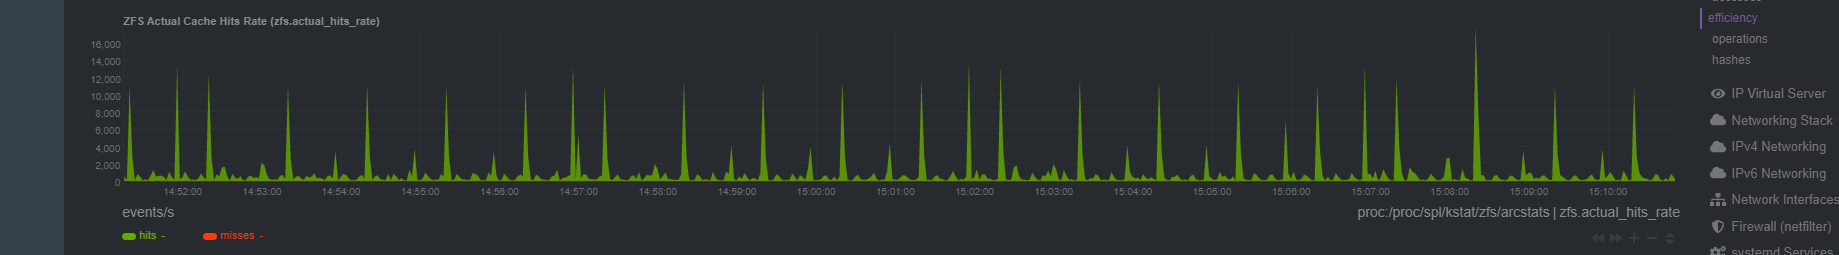
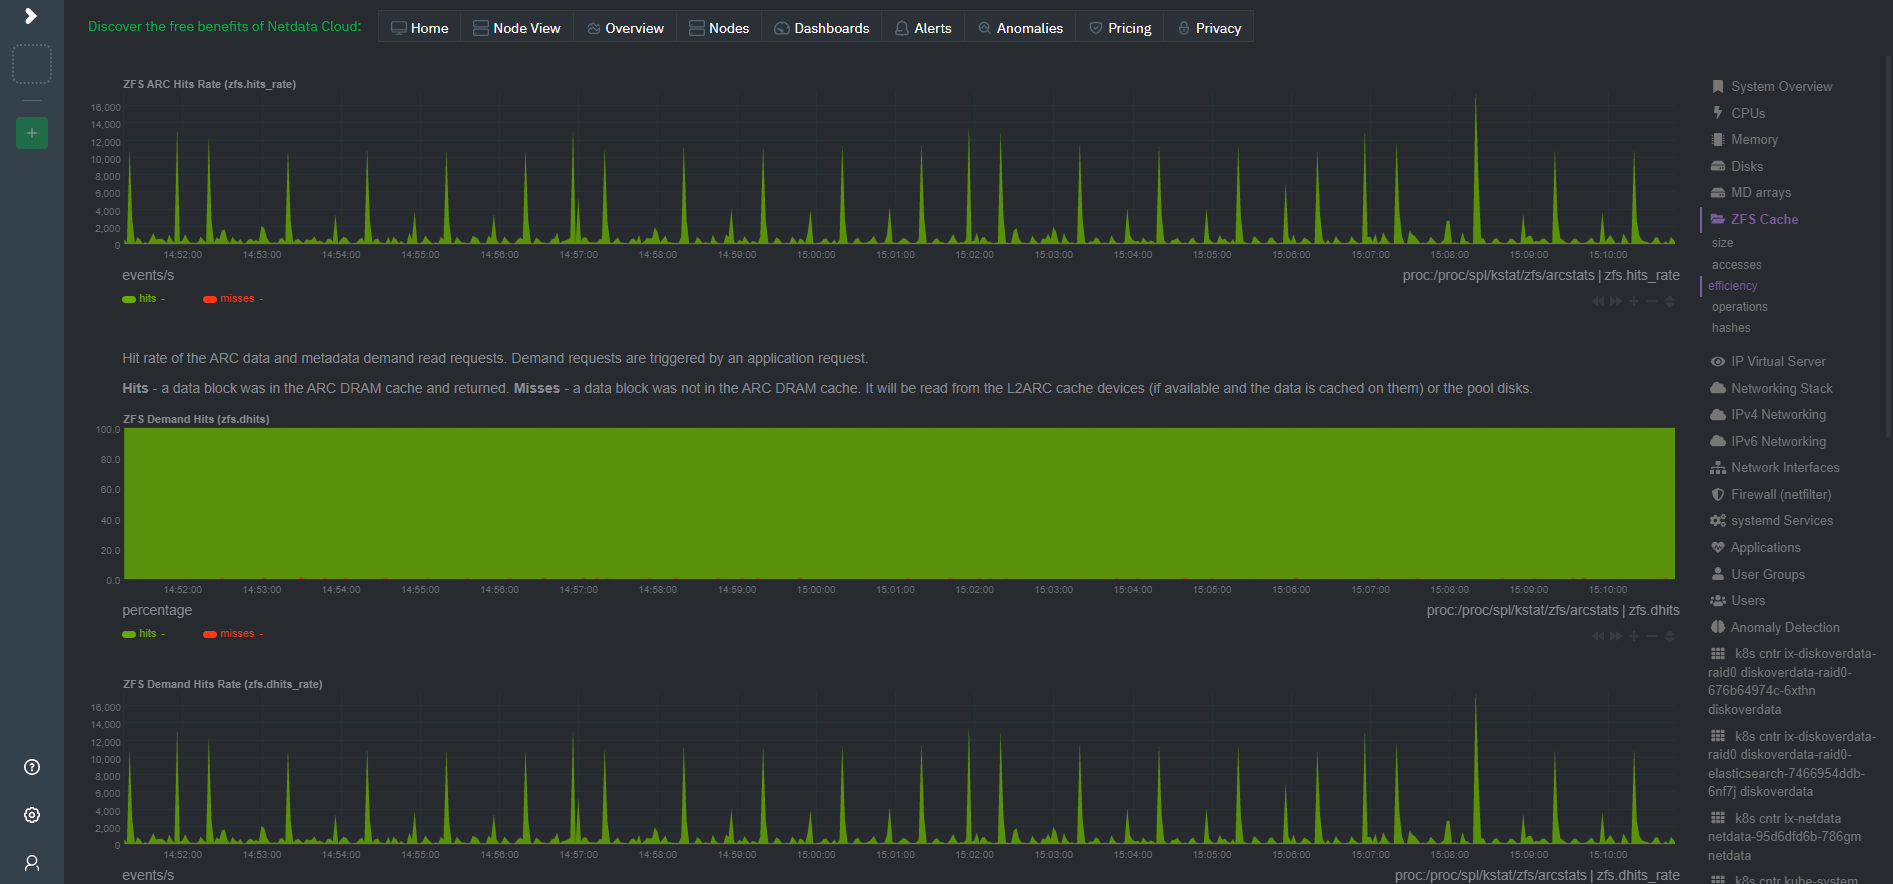
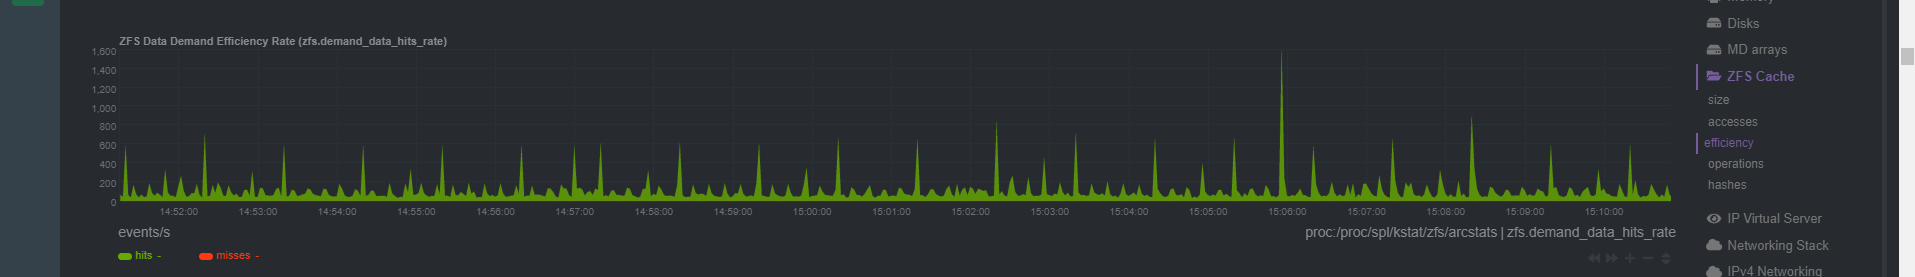
I just deleted several GB and got again almost continuous "4k" reads on two disks:
So my theory is
- DDT got for some reason clustered on these two disks
- DDT needs many small IO's
- DDT is not in memory (currently arcstats displays arc_meta_used as ~ 5 GB (5432518456), DDT should be around 24 GB) and consequently DDT accesses lead to high numbers of small (i.e. 4K) IO on these disks.
Still it seems strange that only two disks should contain most all of DDT ...
While looking further on information about DDT I stumbled on special vdevs (for dedup) which I weren't aware of.
Also I found https://www.truenas.com/community/goto/post?id=604334 for heavy 4k reads (and hint to special vdev, too).
I didn't want to try adding a special vdev (may not be able to remove it and it won't help for already allocated DDT entries anyway) on the fly, so instead I'll try a 64 GB SSD l2arc with secondarycache=metadata as an "approximation" for testing.
Even with l2arc copying a larger amount of data is still slow, I'd guess around 10-20 MB/s (considerably higher as the initial 2,4 MB/s).
So contrary to #7971 it seems l2arc does help. I'm seeing mostly 60% and up to 75% l2arc hit rate (dstat --zfs-l2arc) when doing a cp copy (of course after loading l2arc). The two disks under surveillance do less reads (still ~ 100 fold more than the other disks, though, but that would coincide with "verify" of dedup-blocks) but end up being busy at about 80% (where the other disks are around 40%). I take it as a confirmation of the high reads beeing metadatat (probably ddt) related.
A quick glance into vdev_raidz.c didn't get me very far. It does seem however as if the case of metadata ending up always on same disks had been considered and partly taken into account, but seemingly only for raidz. It also seems as if parity were on the first "colums". With raidz3 this could be disks 1-3 and data on disk 4 and if repeated parity on 5-7 and data on 8. At least that would match the readings. But it might be entirely different as zfs is not trivial to understand and I might be looking wrongly in the first place.
It seems as if it would have helped tremedously if Ahrends idea of a log structured ddt were to come alive.
i can't believe you've been pushing on this poorly-built system since September. why can't you rebuild it correctly without dedup? raidz3 is also extremely slow. i don't see anything that can be done here for you.
Well, I consider dedup a much neglected zfs feature and understand some may view its use as incorrect per se, which I would not agree too. I'm also not too fond of "it's complicated, don't use it".
Many times I read about memory implications of dedup and sometimes a recommendation to ssd's. Only little by little did I unravel more of the performance implications (like "dedup performance sucks" from Ahrends). I would say I've learned something along the way that is valuable to me and may be of help to others.
What is still left open is exactly what makes zfs use two disks significantly more than the other six. So far my theory is, this is DDT needing to be checked and updated for every (even non-deduplicatable) write and seeming to reside on mostly two disks. But why zfs would almost always select the same disks for DDT is not exactly clear to me. And I'd think this to be a strong enough issue to be called a bug.
That's why I opened the bug report and I'd really appreciate any help in getting a better understanding of the cause and would be really glad if a solution could be found - be it a variation in disk selection or a fresh stab at Ahrends suggestions.
As of Feb 2022 vdev_raidz_map_alloc in https://github.com/openzfs/zfs/blob/master/module/zfs/vdev_raidz.c states "Divides the IO evenly across all child vdevs" and " We therefore switch the parity every 1MB." being only implemented for raidz. Digging in history it seems zfs started with raidz and only later added raidz2 (https://github.com/illumos/illumos-gate/commit/99653d4ee642c6528e88224f12409a5f23060994#diff-5b2b3aae2d3cb50f4ea623f5773095d55fa1b12d140e65e9526527943a97d30e). The code to avoid "Hot parity disks" seems to have been deemed unnecessary and thus not been extended to raidz2 (nor later to raidz3). Probably because of backward compatibility with the on disk format for raidz it was left in place for raidz.
Currently rr->rr_firstdatacol is set to nparity and the switching takes place via if (rr->rr_firstdatacol == 1 && (zio->io_offset & (1ULL 20))).
Generalization beyond raidz could be done via selection of parity to be switched with data via (zio->io_offset >> 20) % (nparity+1). However this would change on-disk format. Therefore it would probably also require a new feature flag / pool version.
Not sure what to make of it: Fixing it would require changeing on-disk format which is at least difficult but probably close to impossible. But could be a corner case depending on number of disks (and dedup) and may be much better avoided by pursuing a log structured DDT as Ahrends suggested.
Neither of RAIDZ variants are good for 4KB writes, especially if you have ashift=12, independently of "Hot parity disks" "feature". You could consider dedicated special vdev for dedup data. Or for much better results you should have enough RAM to cache the whole dedup table at once in ARC and so avoid reading it from disk and so caring about what disks are parity and what not.
The issue at hand is not a problem of small writes per se, like from a database. It rather is a problem of writes beeing transformed in a plethora of 4k IO which mostly hammer always the same two disks. This last element - not evenly spread load - was the very reason to create this issue.
My analysis in this issue led me to belive, it is caused by DDT-Entries read: They easily fit into one "ashift=12" sector forcing zfs to use three more for parity for a total of 4. This divides evenly for my setup of 8 disks resulting in high (read) IO to only two disks. Had I had 9 disks the issue may well have passed me by.
A dedicated vdev for dedup data certainly could be an option. I haven't known about it originally (see my comment from February 1st https://github.com/openzfs/zfs/issues/12538#issuecomment-1026384334) but it won't help for existing dedup entries and the dedicated vdev may never be removed again. To get it in a comparable redundancy as raidz3 wouldn't be simple in my build (e.g. lack of bays and ports), too.
It never seems as if the DDT (~ 25 GB) would stay in RAM nor in l2arc. It seems too sparsely used to not be evicted, but I may just have too little memory assigned. It would help if there were a way to load DDT explicitly. But then again, it would be even better if it were reduced in size (half seems well possible) and converted to a log structured DDT (https://openzfs.org/w/images/8/8d/ZFS_dedup.pdf).