[feature] Charts: allow specifying range of dates #26
ScreenRecorder_2022-07-04_b5fd60c1-f402-4f61-bc68-aa57b897f09b.webm
Fixes #26
Checks:
- [ ] I have manually tested the proposed changes
- [ ] I have written new test cases to avoid regressions (if necessary)
- [ ] I have updated the documentation (e.g. README.rst)
Coverage remained the same at 98.717% when pulling 9b68ed67cd9da2f8c52e8cd98ff182b0dc2b73f4 on issue-26-daterange into 76942a31e0d655a246eb846c94434fc53e14795c on master.
Update:
https://user-images.githubusercontent.com/77020164/177357461-f1a0b52a-81c0-4681-b735-ee96297baa57.mp4
Hey @nemesisdesign! How can we define grouping for a selected number of the date range?
- We have the functionality currently for the last specific last
3 daysfrom the current date but if any user selects a 3-day range from any particular month then how we can access that. - or if a selection of more than a month and less than a year maybe
7 monthswhat number of bars we should show and how we can calculate the grouping, any rough idea.
Here is the flow chart, of the basic functionality of thecustom date range: https://lucid.app/lucidspark/1106a39d-adc1-40fa-bb43-c4a935419eb2/edit?viewport_loc=-3580%2C-2252%2C7328%2C3792%2C0_0&invitationId=inv_a267a3c5-6241-4d28-8467-22be64dffadf#, it is editable.
Hey @nemesisdesign! How can we define grouping for a selected number of the date range?
- We have the functionality currently for the last specific last
3 daysfrom the current date but if any user selects a 3-day range from any particular month then how we can access that.
I don't understand this question.
- or if a selection of more than a month and less than a year maybe
7 monthswhat number of bars we should show and how we can calculate the grouping, any rough idea.
A good start would be: anything more than 28 days (to account for February) can be grouped as 1d.
Anything less than 28 days but more than 3 days should have the same number of points that the weekly timeframe has: right now the weekly time frame is grouped by 1h, which gives around 164 values. Not sure why I see 164 values, if I calculate this I get the 168, but it's not a big deal, here's how I calculate it:
24 hours (1 day) multiplied by 7 days (1 week) divided by 1 (hour) 7 * 24 / 1 = 168
So let's say a user selects a period of 3 weeks:
7 * 24 * 3 = 504 let's divide it by 168: 504 / 168 = 3
So if a user selects 3 weeks we should group by 3 hours in order to get 168 points.
This means the grouping should be dynamic in this situations.
In the future we can see if it makes sense to allow changing it and how to do that.
Let me know if it's clear, if not, please ask questions!
Here is the flow chart, of the basic functionality of thecustom date range: https://lucid.app/lucidspark/1106a39d-adc1-40fa-bb43-c4a935419eb2/edit?viewport_loc=-3580%2C-2252%2C7328%2C3792%2C0_0&invitationId=inv_a267a3c5-6241-4d28-8467-22be64dffadf#, it is editable.
I did a minor modification to the message displayed to the user in case there's no data to display, the rest looks good.
A good start would be: anything more than 28 days (to account for February) can be grouped as 1d.
Anything less than 28 days but more than 3 days should have the same number of points that the weekly timeframe has: right now the weekly time frame is grouped by 1h, which gives around 164 values. Not sure why I see 164 values, if I calculate this I get the 168, but it's not a big deal, here's how I calculate it:
24 hours (1 day) multiplied by 7 days (1 week) divided by 1 (hour) 7 * 24 / 1 = 168
So let's say a user selects a period of 3 weeks:
7 * 24 * 3 = 504 let's divide it by 168: 504 / 168 = 3
So if a user selects 3 weeks we should group by 3 hours in order to get 168 points.
This means the grouping should be dynamic in this situations.
In the future we can see if it makes sense to allow changing it and how to do that.
Let me know if it's clear, if not, please ask questions!
Yeah! it's clear, I will ask if I would face any doubts during implementation.
Working Demo: As per the selection of custom daterange from the widget the data is shown on the charts with the x axis denoting the start and the end date.
https://user-images.githubusercontent.com/77020164/180427376-4c4d294a-51a6-4d1e-84b5-a5c4b312f9be.mp4
1: This is with all red selected ranges:
https://user-images.githubusercontent.com/77020164/181543624-e0a2c60f-8233-497f-9cfe-925cdfe3b932.mp4
2. This is with light red selected ranges but the start and end point are dark.
https://user-images.githubusercontent.com/77020164/181543756-85d756bb-60fa-4dfa-91cd-3bd6c036d5e5.mp4
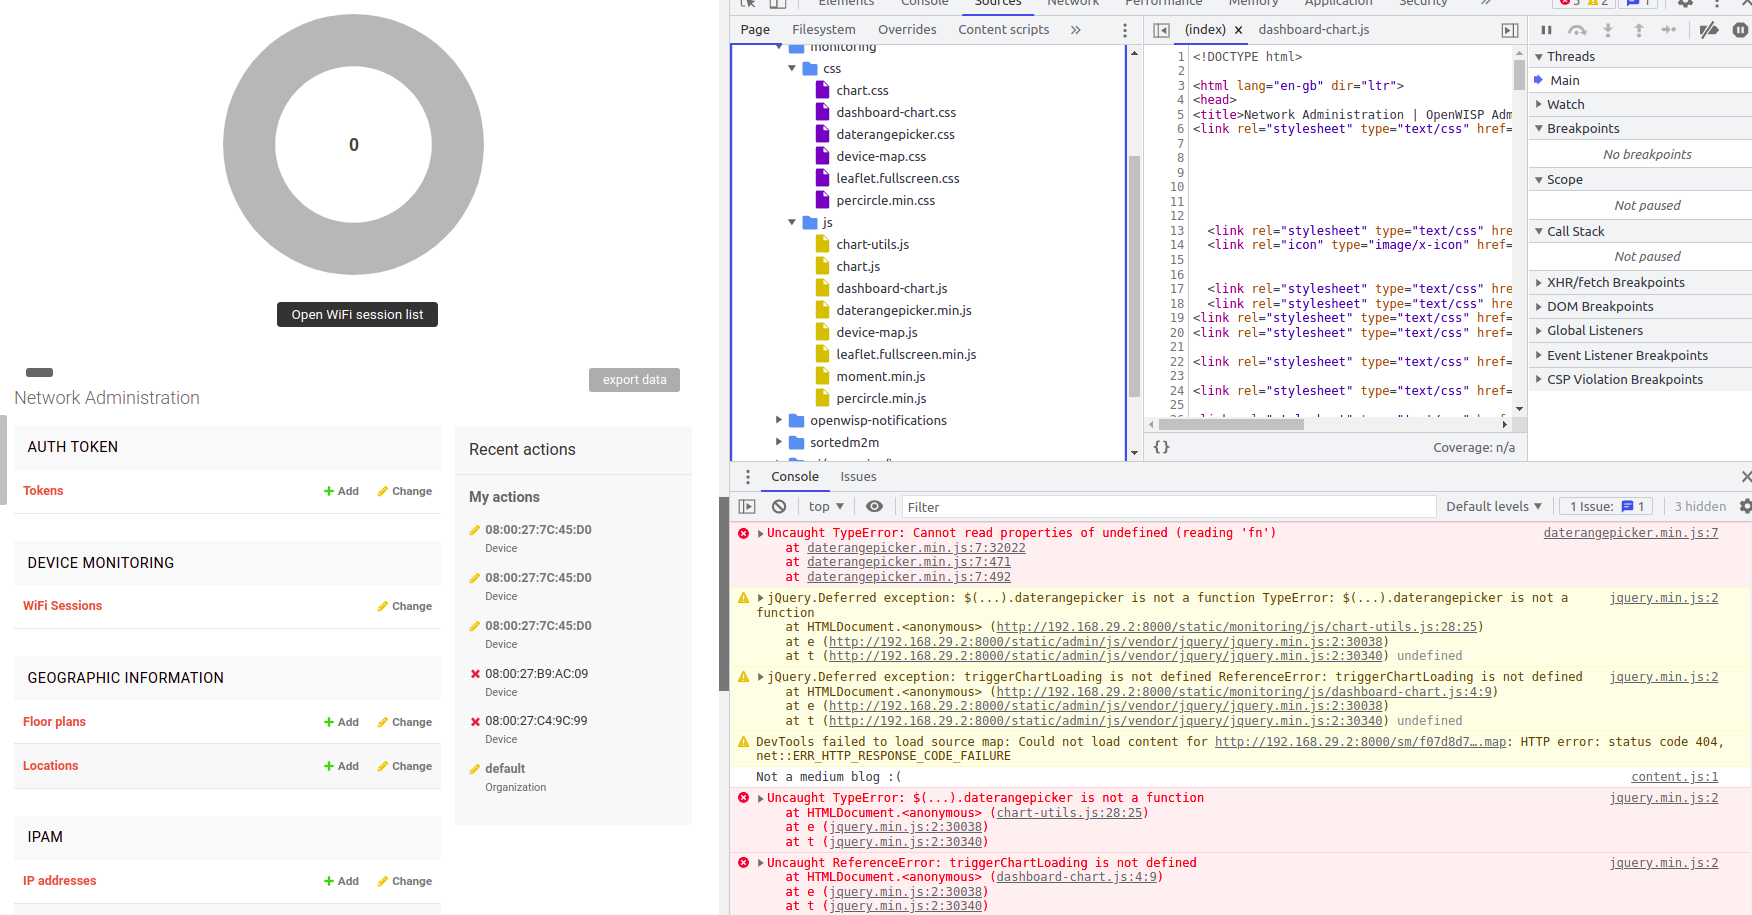
The daterangepicker.min.js, moment.min.js, and daterangepicker.css all are included in openwisp_monitoring/device/static/monitoring/ but then too the dashboard is having errors, I have followed the procedure as suggested above.
https://user-images.githubusercontent.com/77020164/183014666-2bc70288-a3bd-436a-93ff-99f4dbd79009.mp4
Requested UI Changes:
https://user-images.githubusercontent.com/77020164/183847145-6a537d6c-2be9-4606-8e05-f48954b3bd58.mp4
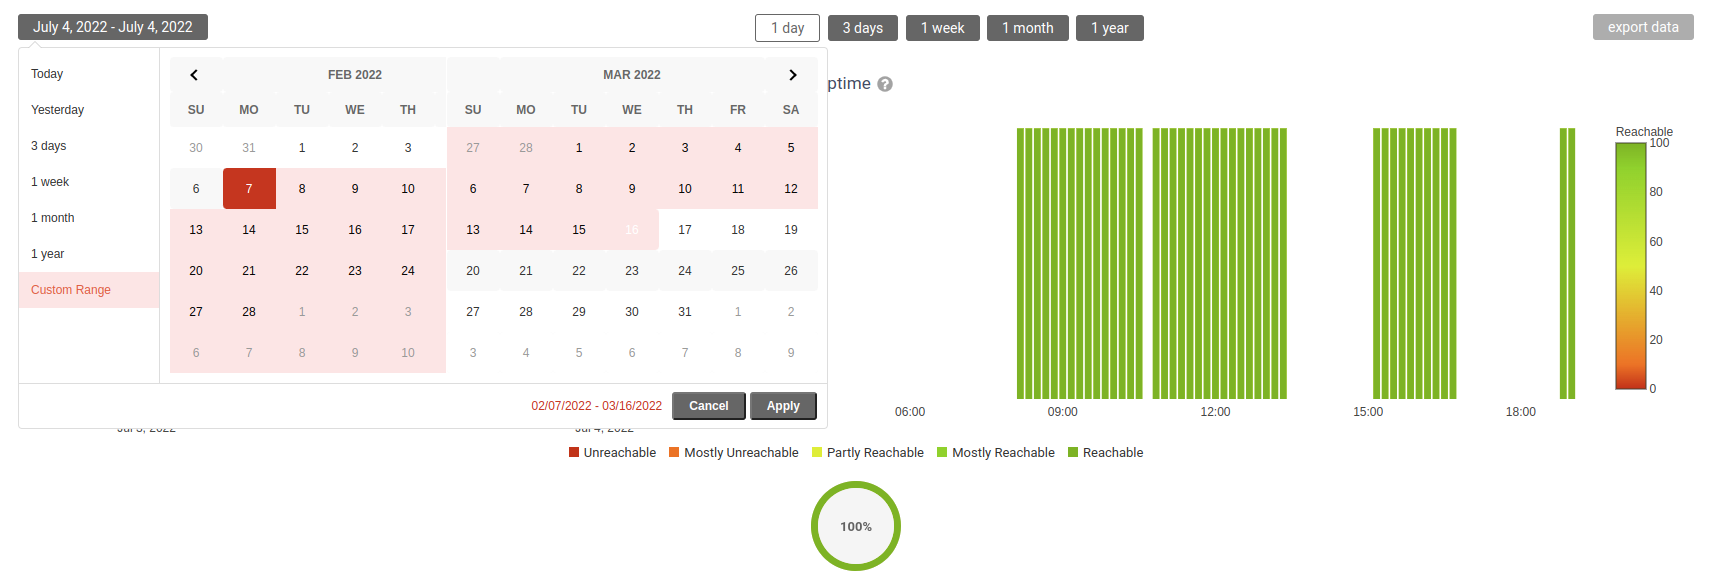
Custom date range
OpenWISP 22.05: feature not available.
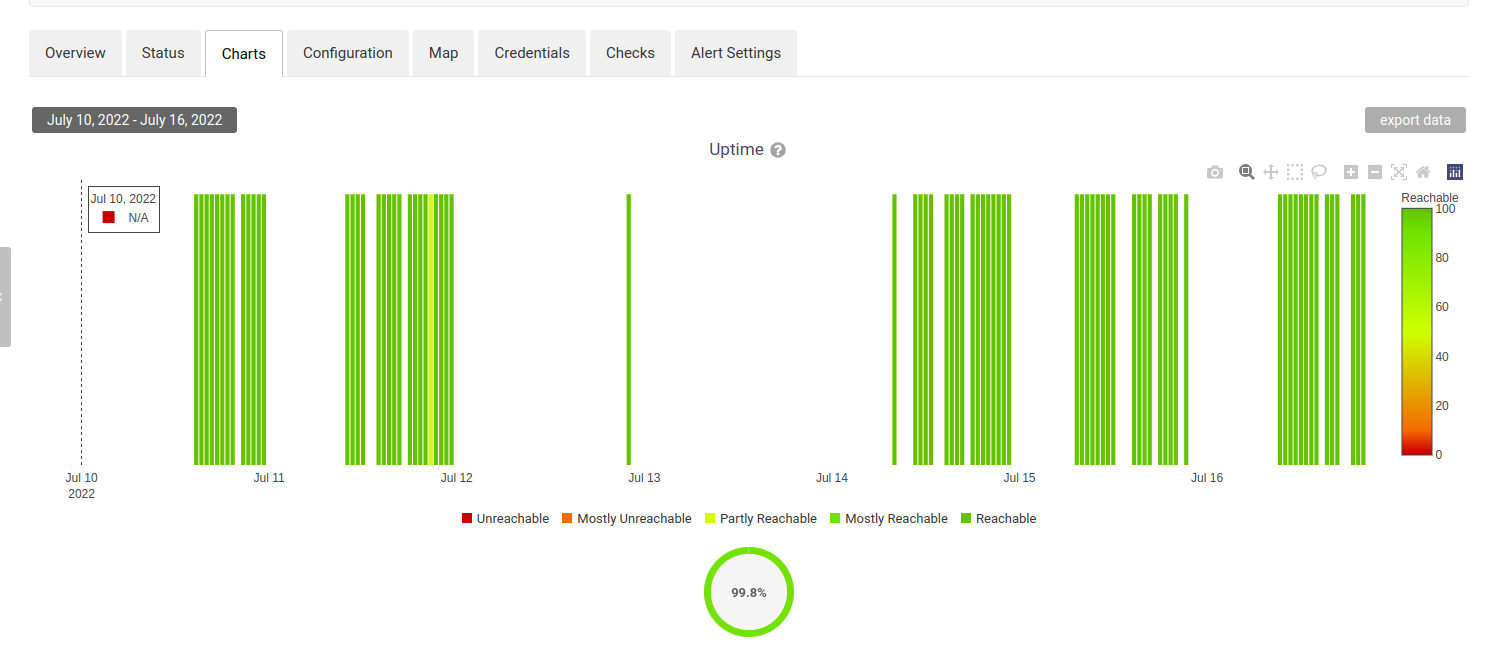
OpenWISP gsoc22-demo branch on demo: I am selecting July 10 to July 16, the starting point is July 10 at 21:20, this is problematic, because if am telling the system that I want to analyze July 10, I mean the whole day, not just the end of the day, here we must start from July 10 at 00:00. The last point instead is at July 17 at 16:00, which is far out of the range, here we should show until the last available point of July 16, or at max 00:00 of July 17.
July 10 00:00 - July 16 20:00
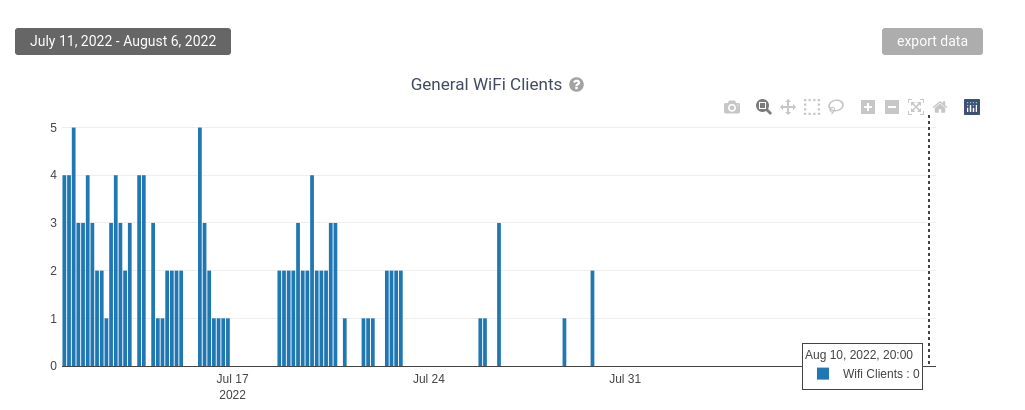
Problem: I see Aug 10 when the date range ends at Aug 6.
- Open demo instance.
- Go to the first graph on home page
- Select range
July 11 - Aug 6
I noticed another corner case in the demo instance.
Notice the data is shown after the end date.
Pl. check it on pandafy-archer-c50 in demo instance. 😄
P.S: Just to summarize, 2 + 3 issues are reported on this PR now. (Pl. do message once you address each one of them!)
P.S: @yashikajotwani12, I found something similar to what Fed reported.
some start from other times of the day.
I think it might be a timezone related issue. Somewhere UTC is used and at other places a TZ(like IST in my case) is picked causing shift in time. You might wanna check that. (Let me know if that didn't make sense, I'll explain with an example! 😄 )
Another problem I have noticed:
I select a custom range, eg: June 1 to August 11. When I select August 11, the widget goes back to July (why??).
@nemesisdesign ,This is its default behavior to show the users the start date they selected and from there they can see their range. I would find out if it's possible that the picker does not go back to the start date.
I noticed another corner case in the demo instance. Notice the data is shown after the end date. Pl. check it on
pandafy-archer-c50in demo instance. smile
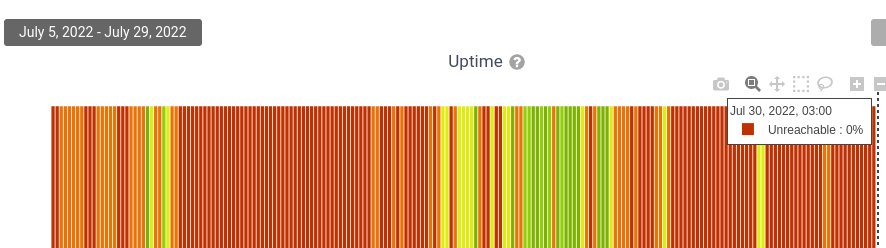
@atb00ker
For me in demo instance, in pandafy-archer-c50, it shows from 5 July 00:00 to 29 July 6:00, kind of weird 🤔.
https://user-images.githubusercontent.com/77020164/184279439-1e2f99e1-78f5-467a-980d-5b83efcaae94.mp4
I have noticed a problem sometimes:
- Logout on demo instance
- Log back in.
- The graph on the dashboard doesn't load. Is it potentially related to this? 🤔
- Refresh page and the graph loads!
Edit: Yes, it happens on first load in the device page as well.
Screenshot:
P.S: If you can repro it, the pl. check on master branch as well, if it happens after login!
Ref: https://github.com/openwisp/openwisp-monitoring/pull/410#issuecomment-1212693912
For me in demo instance, in pandafy-archer-c50, it shows from 5 July 00:00 to 29 July 6:00, kind of weird
If you move you mouse a little, it should show 30th as well! 😓
But on repeated testing, I don't see the 3:00 AM log, only 12:00 AM which is acceptable, imo.
Maybe it's a time related thing.
Will check again and let you know! 🤔
Either all weird bugs are happening on my browser right now, or this should happen for all.
First load after login on chrome:
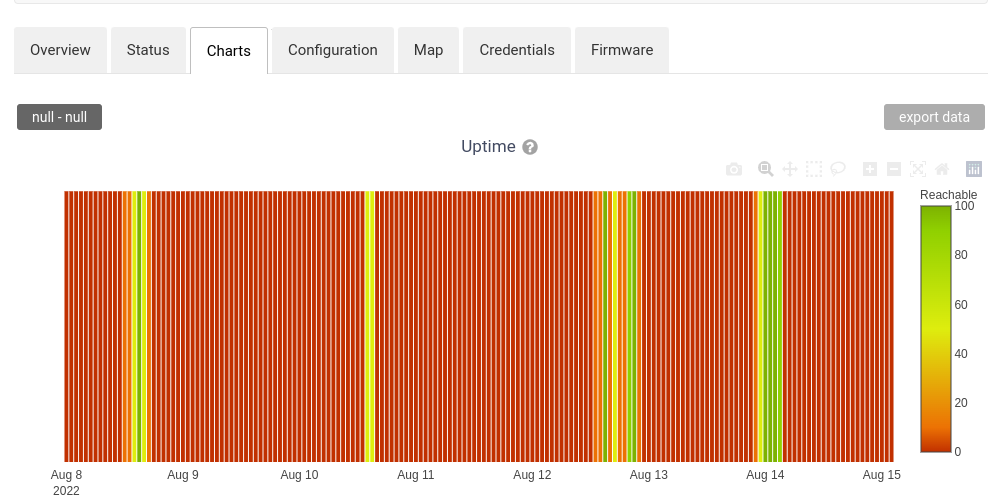
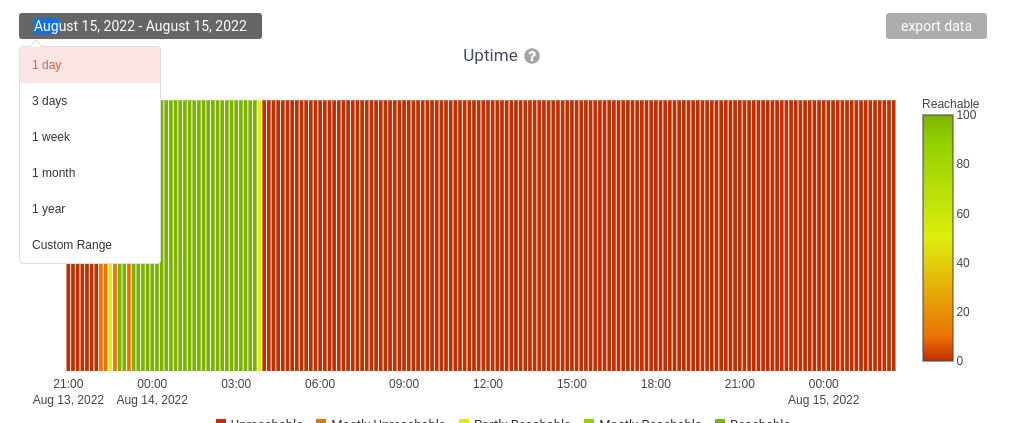
Now, I selected one day and it's giving me 13th and 14th as well and showing 15th August - 15th August? 😮
Even if I try to use custom range for one day, it's showing a bit of previous day.
Now, I selected one day and it's giving me 13th and 14th as well and showing 15th August - 15th August? open_mouth
Hey @atb00ker because this chart is for 1 day and it is the same as we see without the daterangepicker widget but on the widget head it shows 15 Aug because it denotes that the chart is of 1 day and the data loaded is the same as that we see without widget.
Either all weird bugs are happening on my browser right now, or this should happen for all.
First load after login on chrome:
Updated for this condition as well, won't see this now again.
Hey @atb00ker because this chart is for 1 day
Yes, I understand that, but:
- It's more than 24 hours.
- 15 Aug - 15 Aug is still wrong, if this is not a side effect of this PR, can you please open a issue to fix that separately! 😄
Hey @atb00ker because this chart is for 1 day
Yes, I understand that, but:
- It's more than 24 hours.
- 15 Aug - 15 Aug is still wrong, if this is not a side effect of this PR, can you please open a issue to fix that separately! smile
If it's this case, we can change it for 1 day 14 Aug - 15 Aug. something like this.
https://user-images.githubusercontent.com/77020164/185428743-20097634-4a93-4124-b142-8c018ee3e77d.mp4
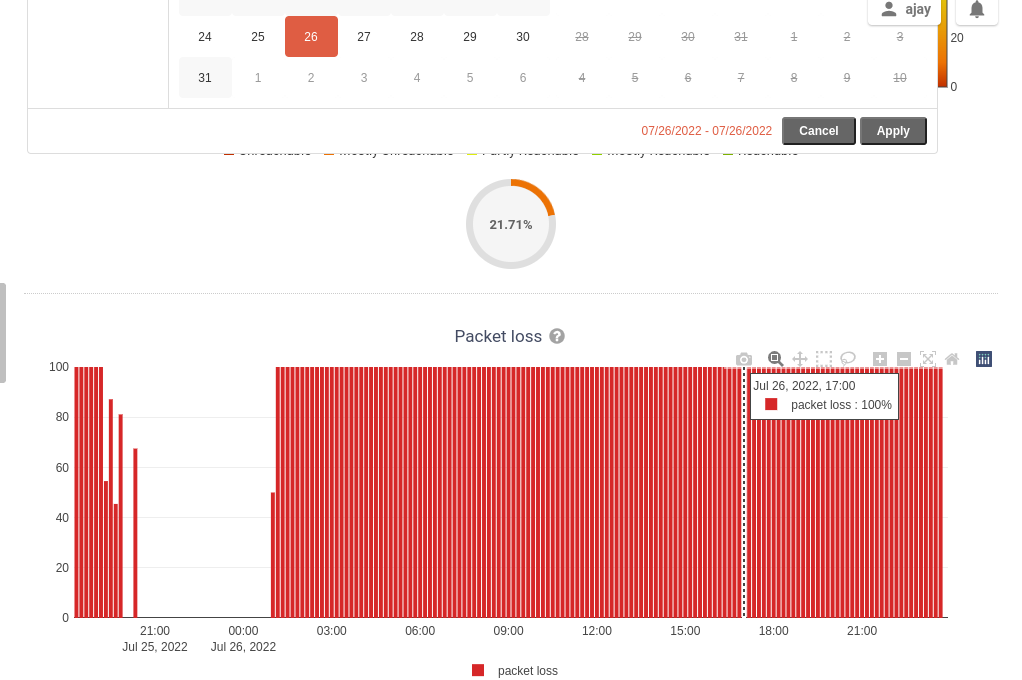
When selecting 1 month range 30 July was partially reachable and when selecting data between 25 July to 1 Aug we can see that 30 July data are partially reachable.
- Export csv functionality works for selected daterange.
- General charts also work for selected daterange.
Earlier the data loaded was taking this data_query like this.
'packet_loss': {
        'influxdb': (
            "SELECT MEAN(loss) AS packet_loss FROM {key} WHERE "
            "time >= '{time}' AND content_type = '{content_type}' AND "
            "object_id = '{object_id}' GROUP BY time(1d)"
        )
    },
and according to this time > {given time} and less than now as mentioned here https://docs.influxdata.com/influxdb/v1.7/query_language/data_exploration/#time-syntax, so for the custom daterange we have to change the end_date of the query from now to like this
"time >= '{time}' AND time < '{time}' + {timespan} "