opennem
 opennem copied to clipboard
Optimize per-interval NEM processing
Optimize per-interval processing for NEM
It is taking ~90 seconds to complete all per-interval tasks
Crawler is running within 7-8 seconds on average to process:
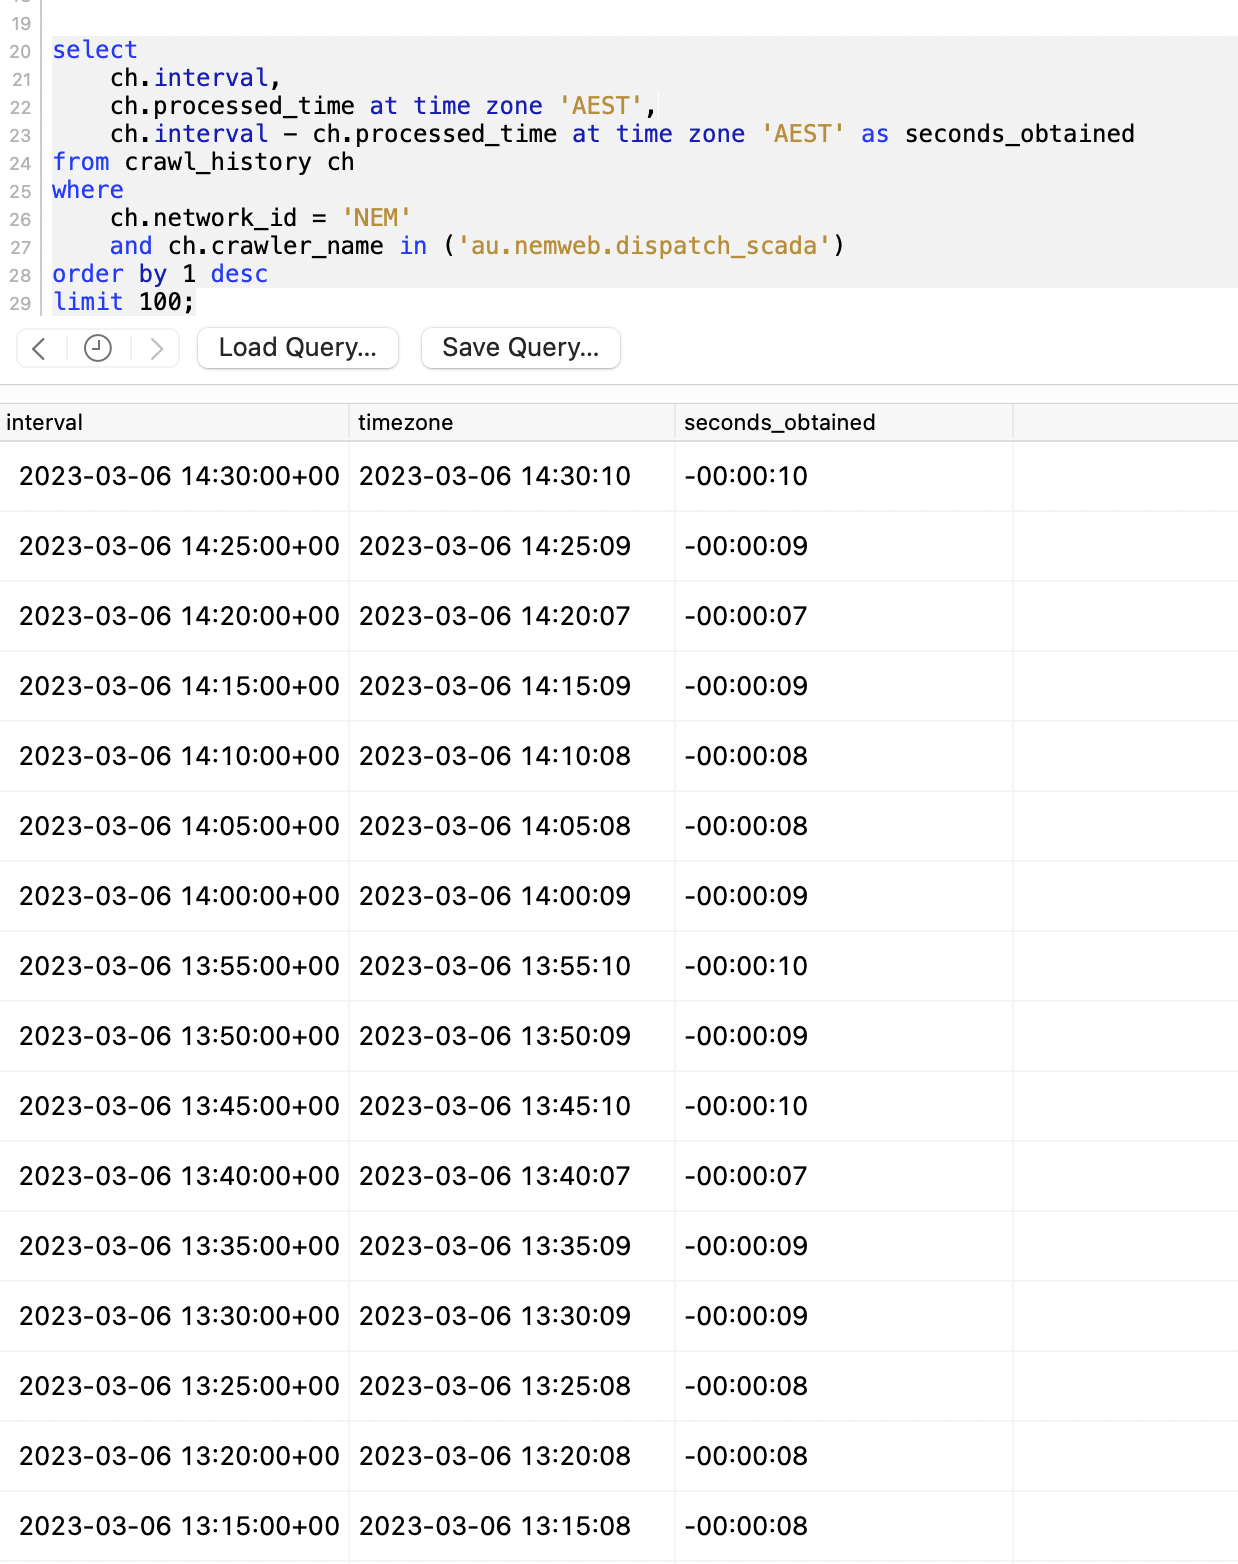
The crawler is taking ~7-8s on average to get the data in (and in-turn, out into the API)
We need to optimize the per-interval flow calculation, as well as writing out JSON's
- [ ] profile the task and a breakdown of what is spent where (flamegraph profile) - CPU time, SQL time, IO etc.
- [ ] compare dev/staging/prod and see what impact CPU type has, memory
- [ ] low-hanging optimizations in
aggregates.net_flows(ex. stringify dates, don't use bulk inserter per-interval)
run_flow_update_for_interval(datetime.fromisoformat("2023-03-07T00:00:00+10:00"), network=NetworkNEM, number_of_intervals=1)
on dev flamegraph - it's all in io wait from pandas for the query
https://gist.githubusercontent.com/nc9/310d0f8fe024c4b6db9dba44db285300/raw/1bd3a16e1741b2abab085d142c1a1b5aef0fc804/run_test.py-2023-03-07T12:37:06+11:00.svg
This query:
https://github.com/opennem/opennem/blob/master/opennem/aggregates/network_flows.py#L71
select
    t.trading_interval,
    t.network_region,
    sum(t.power) as generated,
    sum(t.market_value) as market_value,
    sum(t.emissions) as emissions
from
(
    select
        fs.trading_interval as trading_interval,
        f.network_region as network_region,
        sum(fs.generated) as power,
        coalesce(sum(fs.generated) * max(bsn.price), 0) as market_value,
        coalesce(sum(fs.generated) * max(f.emissions_factor_co2), 0) as emissions
    from facility_scada fs
    left join facility f on fs.facility_code = f.code
    left join network n on f.network_id = n.code
    left join (
        select
            time_bucket_gapfill('5 min', bs.trading_interval) as trading_interval,
            bs.network_id,
            bs.network_region,
            locf(bs.price) as price
        from balancing_summary bs
            where bs.network_id='NEM'
    ) as  bsn on
        bsn.trading_interval = fs.trading_interval
        and bsn.network_id = n.network_price
        and bsn.network_region = f.network_region
        and f.network_id = 'NEM'
    where
        fs.is_forecast is False and
        f.interconnector = False and
        f.network_id = 'NEM' and
        fs.generated > 0
    group by
        1, f.code, 2
) as t
where
    t.trading_interval >= '2023-03-06 23:55:00+10:00' and
    t.trading_interval < '2023-03-07 00:00:00+10:00'
group by 1, 2
order by 1 asc, 2;
here's the query plan:
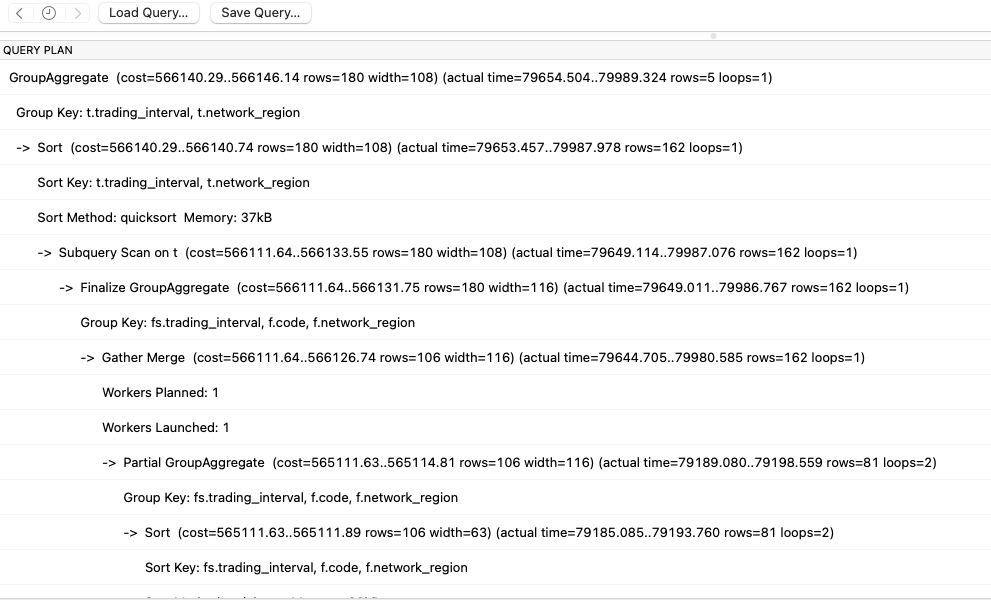
here it is parsed:
https://explain.dalibo.com/plan/b1842c8ge84b81e9
"trading_interval","network_region","generated","market_value","emissions"
"2023-03-06 13:55:00+00","NSW1",6421.208179,511962.92811167,4537.1484928540295
"2023-03-06 13:55:00+00","QLD1",7191.572573,501468.35551529,6243.178760527726273404999
"2023-03-06 13:55:00+00","SA1",1814.54734,-5625.096754,88.7169226214130041
"2023-03-06 13:55:00+00","TAS1",578.898799,6425.7766689,0
"2023-03-06 13:55:00+00","VIC1",5684.846761,113.69693522,3421.8557410616931
json writing flame-graph
https://gist.githubusercontent.com/nc9/2122d15b3445f2a030baca002b0a3ebd/raw/bdd1f607cc76087234e651b1eec3eac4e233bc0f/run_test.py-2023-03-07T13:57:50+11:00.svg
23 seconds total time
3 seconds now, with ~600ms of network latency
https://gist.githubusercontent.com/nc9/9f3a259067d3c5af67438a0018a4032d/raw/b4275b5bbb2c90105582b3ec33d539aca644f7ab/run_test.py-2023-03-08T08:14:45+11:00.svg
https://explain.dalibo.com/plan/461c4fa629gd4852
def calculate_flow_for_interval(df_energy_and_emissions: pd.DataFrame, df_interconnector: pd.DataFrame) -> pd.DataFrame:
    """Calculate the flow for a given interval

    df_energy_and_emissions:
        generation and emissions data for each network region
            - energy (MWh)
            - emissions (tCO2)
    df_interconnector:
        interconnector data for each regional flow direction energy that is
            - energy (MWh)

    returns
        a dataframe for each region with the following columns
            - emissions imported (tCO2)
            - emissions exported (tCO2)

    """
    pass
new definition for shape of inputs and outputs