openmm
 openmm copied to clipboard
Optimize memory access in computeNonbonded
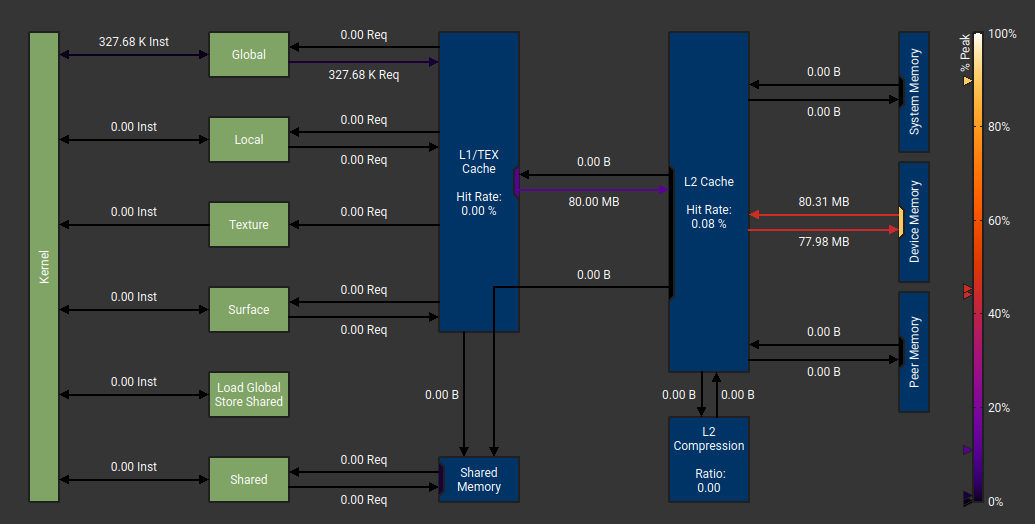
Here is some initial profiling of memory accesses in computeNonbonded using nsight-compute - this is a single execution of the computeNonbonded kernel on the STMV system:

Collected with:
/opt/nvidia/nsight-compute/2021.3.0/ncu --kernel-regex computeNonbonded --launch-skip 500 --launch-count 1 --set full --export a10g-report "/home/ubuntu/miniconda3/bin/python" benchmark.py --platform=CUDA --test=amber20-stmv --seconds=200
(openmm-7.6.0, single A10G gpu on AWS g5 instance)
Trace here: https://gist.github.com/aizvorski/833ca0a9eecd85f929ab968cf4335249/raw/696203b7335119645fc870f9024376eb8ee1a7a1/a10g.ncu-rep
What's expected to happen in theory (?): This system has 1.07M atoms, and ~164M pairs of atoms which are within the cutoff=0.9nm of each other (counting a,b and b,a as one pair). If the pairs of atoms are tiled perfectly into tiles of size 32x32, there would be 164M/(32*32) = ~160k tiles. Each tile would require reading the positions and charges for 32+32 atoms, or (32+32)*(3+1)*4 = 1024 bytes; and reading and writing the updated forces (stored as 64bit fixed point) for 32+32 atoms, or (32+32)*3*8*2 = 3072 bytes. The total memory access would be 655MB read and 491MB written. If there is less than 100% effective tile utilization and some padding of the cutoff that would increase this proportionately.
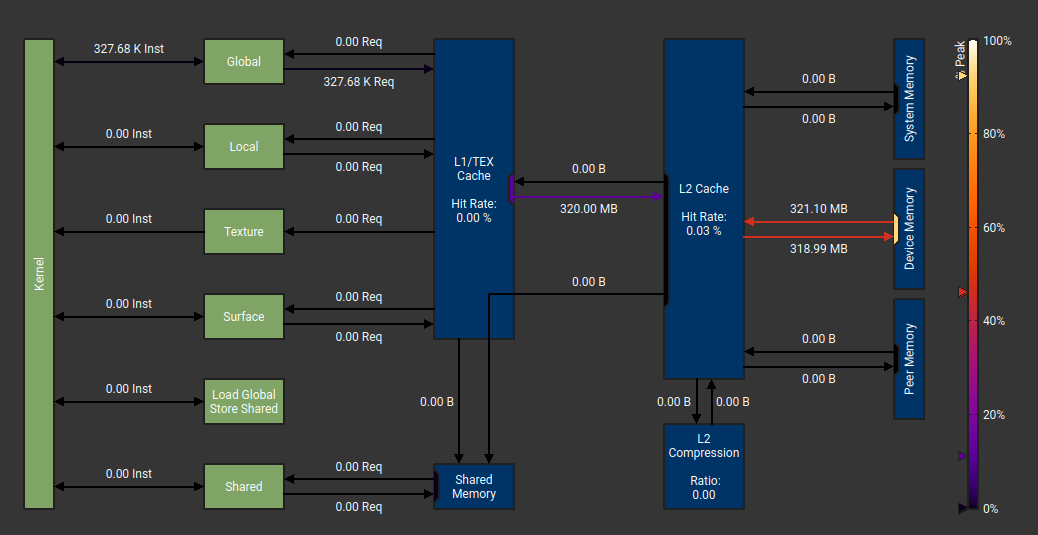
What happens: 3.0GB read and 1.5GB written to DRAM; L1 cache hit rate 0.66%, L2 cache 36%. Rather more data transferred than expected, and most of it misses the caches. SM busy 24%.
How to optimize this - some ideas:
- The A10 has 128k L1 cache (per SM) and 6M L2 cache (A100 has 196k L1 per SM and 40M L2). This fits a lot of tiles simultaneously, and/or a large fraction of all the forces. Using shared memory, each SM can copy the positions and charges for up to 8k to 12k atoms at a time, and then work on tiles involving only those atoms (probably on the order of 300-500 fairly dense tiles) without hitting DRAM. Single pairs of atoms already in shared memory would also be very fast, and may even be nearly as fast as tiles. This requires some kind of "tiles of tiles" scheme that breaks up the system into chunks that fit nicely in shared memory.
- I think the 64bit fixed point representation of forces is used because there is atomic 64bit addition? This accounts for about 3/4 of the total theoretical bandwidth, and probably has a very non-contiguous access pattern (and probably hits DRAM almost every time, causing a 64-byte read and write per atomic, so it would account for most of the real bandwidth as well). Would it make sense to store the forces in shared memory? (depending on GPU and size of the system, in a lot of cases the forces may fit entirely) This probably requires ordering tiles so a bunch of consecutive tiles all are guaranteed to update different forces, followed by a barrier, repeat; avoiding the need for atomics.
cc @dmclark17 - what do you think?
According to my measurements there are 589M "potential" interactions (i.e. all interactions we check in inner loops for r < cutoff) and only 160M or them are "positive" interactions (r < cutoff), or 27%.
The total memory access would be 655MB read and 491MB written.
That assumes all reads can be fully coalesced. Reading the data for the first 32 atoms in each tile should be coalesced, since they're contiguous. The second set of 32 atoms are not. In the worst case, if every atom were in a different cache lane, that would increase memory bandwidth by (I think?) 4x.
I think the 64bit fixed point representation of forces is used because there is atomic 64bit addition? This accounts for about 3/4 of the total theoretical bandwidth
Where are you seeing that? Your profiler output shows writes to device memory are only about 25% of capacity. Writes to L2 cache are even lower.
According to my measurements there are 589M "potential" interactions (i.e. all interactions we check in inner loops for r < cutoff) and only 160M or them are "positive" interactions (r < cutoff), or 27%.
That seems reasonable to me—was that with a tile size of 32 or 64?
I am finding that the single pairs list optimization is actually causing a regression in this case. When we reenabled it, we found a 5% performance improvement on A100, so it must be system dependent. Since the kernel seems to be more global memory bound for STMV, it makes sense that the optimization would be less effective here.
The force calculation requires more data than just the positions and charges, right? The LOAD_ATOM2_PARAMETERS line expands into loading data from global_nonbonded3_charge and global_nonbonded3_sigmaEpsilon I think.
That seems reasonable to me—was that with a tile size of 32 or 64?
32, these numbers are for CUDA. For CDNA (with hardware warp of 64 and tile size of 64) the number of "negative" (== useless) interactions is even bigger, "positive" interactions are 23%. So increasing single pairs threshold is more important in this case. I haven't yet tested RDNA with hardware warps of 32.
I am finding that the single pairs list optimization is actually causing a regression in this case. When we reenabled it, we found a 5% performance improvement on A100, so it must be system dependent. Since the kernel seems to be more global memory bound for STMV, it makes sense that the optimization would be less effective here.
The force calculation requires more data than just the positions and charges, right? The
LOAD_ATOM2_PARAMETERSline expands into loading data fromglobal_nonbonded3_chargeandglobal_nonbonded3_sigmaEpsilonI think.
Yes, 3 more values, 12 bytes per atom.
For CDNA (with hardware warp of 64 and tile size of 64) the number of "negative" (== useless) interactions is even bigger,
The tile size is always 32, regardless of the hardware. On older AMD GPUs with a SIMD width of 64, that can lead to slightly higher thread divergence, but it usually isn't a major factor. On Intel GPUs with a SIMD width of 16, we need to add extra synchronization to keep the threads processing each tile in sync.
According to my measurements there are 589M "potential" interactions (i.e. all interactions we check in inner loops for r < cutoff) and only 160M or them are "positive" interactions (r < cutoff), or 27%.
@ex-rzr How did you measure this? If you could post a patch that would be great. I'm curious about any method to pull those kinds of stats from the nonbonded kernel, haven't had a chance to hack something together yet.
Also does this mean there are ~575k tiles?
That assumes all reads can be fully coalesced. Reading the data for the first 32 atoms in each tile should be coalesced, since they're contiguous. The second set of 32 atoms are not.
@peastman Yes, quite right, that is assuming coalesced. I think most of the time we would have at least 3 consecutive atoms which are all within the cutoff (eg water), but may not be aligned to a cache line (which is 64 bytes?), so for a "random access water molecules" scenario the transfer would be 2x for the second set; in practice probably somewhat lower around 1.5x.
I think the 64bit fixed point representation of forces is used because there is atomic 64bit addition? This accounts for about 3/4 of the total theoretical bandwidth
Where are you seeing that? Your profiler output shows writes to device memory are only about 25% of capacity. Writes to L2 cache are even lower.
@peastman Sorry, I meant >3/4 of the theoretical minimum amount of data that has to be transferred (with all the assumptions above) would be forces - reading positions and charges would be 163MB, reading and writing forces would be 491MB each direction.
Of course you're right the observed writes alone are a lot less than the theoretical hardware bandwidth; the combined reads+writes are not too far from it though, so it seems overall the DRAM is running at 74% of the hardware max, and it's probably the main performance limiting factor. I think all the writes are forces (?); not sure what fraction of reads are forces.
The force calculation requires more data than just the positions and charges, right? The
LOAD_ATOM2_PARAMETERSline expands into loading data fromglobal_nonbonded3_chargeandglobal_nonbonded3_sigmaEpsilonI think.
@dmclark17 Yes, true, I'm not sure what memory those live in. Are these stored per atom or per atom type? What is the layout, one contiguous array per parameter ie struct of arrays (SoA) or array of structs (AoS)?
If these are read per atom, then the theoretical data read for position, charge, sigma, epsilon becomes (32+32)*(3+1+2)*4=1536 bytes per tile and the total 245MB+491MB.
Yes, true, I'm not sure what memory those live in. Are these stored per atom or per atom type? What is the layout, one contiguous array per parameter ie struct of arrays (SoA) or array of structs (AoS)?
I believe they are stored per atom, and one structure is a float while the other one is a float2. For the j atom block, we are also loading the atom indices.
If I'm reading the nonbonded kernel correctly, it seems like for each tile the kernel loads in both the i and j atom blocks. Could we reorder the tile list such that the i atom block is kept in registers and we iterate over all j atom blocks that are interacting with it? I believe this would require modifying findBlocksWithInteractions such that all the Y atom blocks for an X atom block are written in order or sorting the tile list afterwards.
I think all the writes are forces (?); not sure what fraction of reads are forces.
I don't believe any forces ever get read in that kernel. They just get updated with atomicAdd() and the return value is ignored, which means no data gets sent back.
Could we reorder the tile list such that the i atom block is kept in registers and we iterate over all j atom blocks that are interacting with it?
I tried that optimization once and found it didn't make any difference. That was some years ago, so it might be different on modern hardware. My guess is that if the same block is used for two successive tiles, the data will already be in L1 cache so loading it is very cheap.
They just get updated with
atomicAdd()
@peastman Isn't atomicAdd implemented as a read/add/write? I don't think the DRAM itself has the ability to add.
if the same block is used for two successive tiles, the data will already be in L1 cache so loading it is very cheap.
But it looks like L1 accesses always miss in this trace, so there is something that makes that not happen.
Is there anything about the tilelist or the grid that makes it so tiles which are nearby in space also get processed by the same SM? I think L1 is per SM, so if nearby tiles get scattered to different SMs that could explain why the L1 cache doesn't have more hits.
@peastman Isn't atomicAdd implemented as a read/add/write? I don't think the DRAM itself has the ability to add.
It's actually implemented at a very low level. Not the DRAM itself, but just above it. Atomics would be incredibly slow if the SM had to stay involved through the whole process.
I tried that optimization once and found it didn't make any difference. That was some years ago, so it might be different on modern hardware. My guess is that if the same block is used for two successive tiles, the data will already be in L1 cache so loading it is very cheap.
Makes sense—I agree that if the kernel processes successive tiles using the same block, they should be L1 hits. However, as @aizvorski said, the profile shows such a low hit rate, it doesn't seem like they are being found in L1. findBlocksWithInteractions is contiguously buffering up to 8 tiles using the same X atom block into interactingTiles—I would think that this would lead to successive tiles using the same block quite often. I can look into this a little more but probably in the new year.
It's actually implemented at a very low level. Not the DRAM itself, but just above it.
@peastman I had no idea! Okay, so this got me interested in how the profiler sees the atomics, so I did a bit of testing using this toy example in cupy which just increments 10M uint64 values using atomicAdd:
import cupy as cp

add_kernel = cp.RawKernel(r'''
extern "C" __global__
void test_add(unsigned long long* a) {
    int tid = blockDim.x * blockIdx.x + threadIdx.x;
    atomicAdd(&a[tid], 1);
}
''', 'test_add')
a = cp.arange(10*1024*1024, dtype=cp.uint64).reshape(10*1024, 1024)
add_kernel((10*1024,), (1024,), (a))

add_kernel = cp.RawKernel(r'''
extern "C" __global__
void test_add_every8(unsigned long long* a) {
    int tid = blockDim.x * blockIdx.x + threadIdx.x;
    atomicAdd(&a[(tid*8) % (10*1024*1024)], 1);
}
''', 'test_add_every8')
a = cp.arange(10*1024*1024, dtype=cp.uint64).reshape(10*1024, 1024)
add_kernel((10*1024,), (1024,), (a))
Results for test_add (on RTX3070TI, cuda=11.5):
and test_add_every8:
So it seems like atomics are basically a L2 cache thing - they show up as reads and writes from DRAM to L2, and writes-only from L1 to L2 if the return value is ignored (I assume this is the "1" value being written every time). The minimum transaction size seems to be 32 bytes (both L1->L2 and L2<->DRAM), but the transactions can be coalesced.
Here 32 bytes seems to be the size of memory sector - according to this presentation on Ampere cache line = 128 bytes and memory sector = 32 bytes.
Both of these kernels max out DRAM bandwidth (near 90%).
One more toy kernel - update 3 consecutive uint64 "forces" for 1M atoms, where the forces are padded to 32 bytes:
add_kernel = cp.RawKernel(r'''
extern "C" __global__
void test_add_x3(unsigned long long* a) {
    int tid = blockDim.x * blockIdx.x + threadIdx.x;
    atomicAdd(&a[(tid*4) % (10*1024*1024)], 1);
    atomicAdd(&a[(tid*4+1) % (10*1024*1024)], 1);
    atomicAdd(&a[(tid*4+2) % (10*1024*1024)], 1);
}
''', 'test_add_x3')
a = cp.arange(10*1024*1024, dtype=cp.uint64).reshape(10*1024, 1024)
add_kernel((1024,), (1024,), (a))
Pretty much as expected now that we know how this works :) It writes 32*3*1M bytes from L1 to L2, reads and writes 32*1M bytes L2<->DRAM since each memory sector is cached after the first force is updated.
That matches my understanding. Since the L2 cache is shared between SMs, it can implement atomic behavior and resolve any conflicts.
According to my measurements there are 589M "potential" interactions (i.e. all interactions we check in inner loops for r < cutoff) and only 160M or them are "positive" interactions (r < cutoff), or 27%.
@ex-rzr How did you measure this? If you could post a patch that would be great. I'm curious about any method to pull those kinds of stats from the nonbonded kernel, haven't had a chance to hack something together yet.
Basically my approach was a naive code-coverage tool based on atomicAdd:
        CudaArray debugCounters;
        std::vector<unsigned long long> debugCountersVec(1000, 0);
        debugCounters.initialize<unsigned long long>(context, debugCountersVec.size(), "debugCounters");
        debugCounters.upload(debugCountersVec);
        forceArgs.push_back(&debugCounters.getDevicePointer());
        context.executeKernel(kernel, &forceArgs[0], numForceThreadBlocks*forceThreadBlockSize, forceThreadBlockSize);
        cuStreamSynchronize(getCurrentStream())
        debugCounters.download(debugCountersVec);
        for (int i = 0; i < 30; i++) {
            printf("%3d: %8llu\n", i, debugCountersVec[i]);
        }
        exit(0);
And I had something like this in the kernel:
#define DC(I) atomicAdd(&debugCounters[I], 1)

__global__ void computeNonbonded(...., unsigned long long* __restrict__ debugCounters) {
   ...
   for (...)
   {
       DC(0);
       if (r2 < CUTOFF_0_SQUARED) { DC(1); }
   }
(Of course it can't be used with profiling/benchmarking as it has a huge impact on performance)
Also does this mean there are ~575k tiles?
Yes, close to this. See red numbers on the right side.
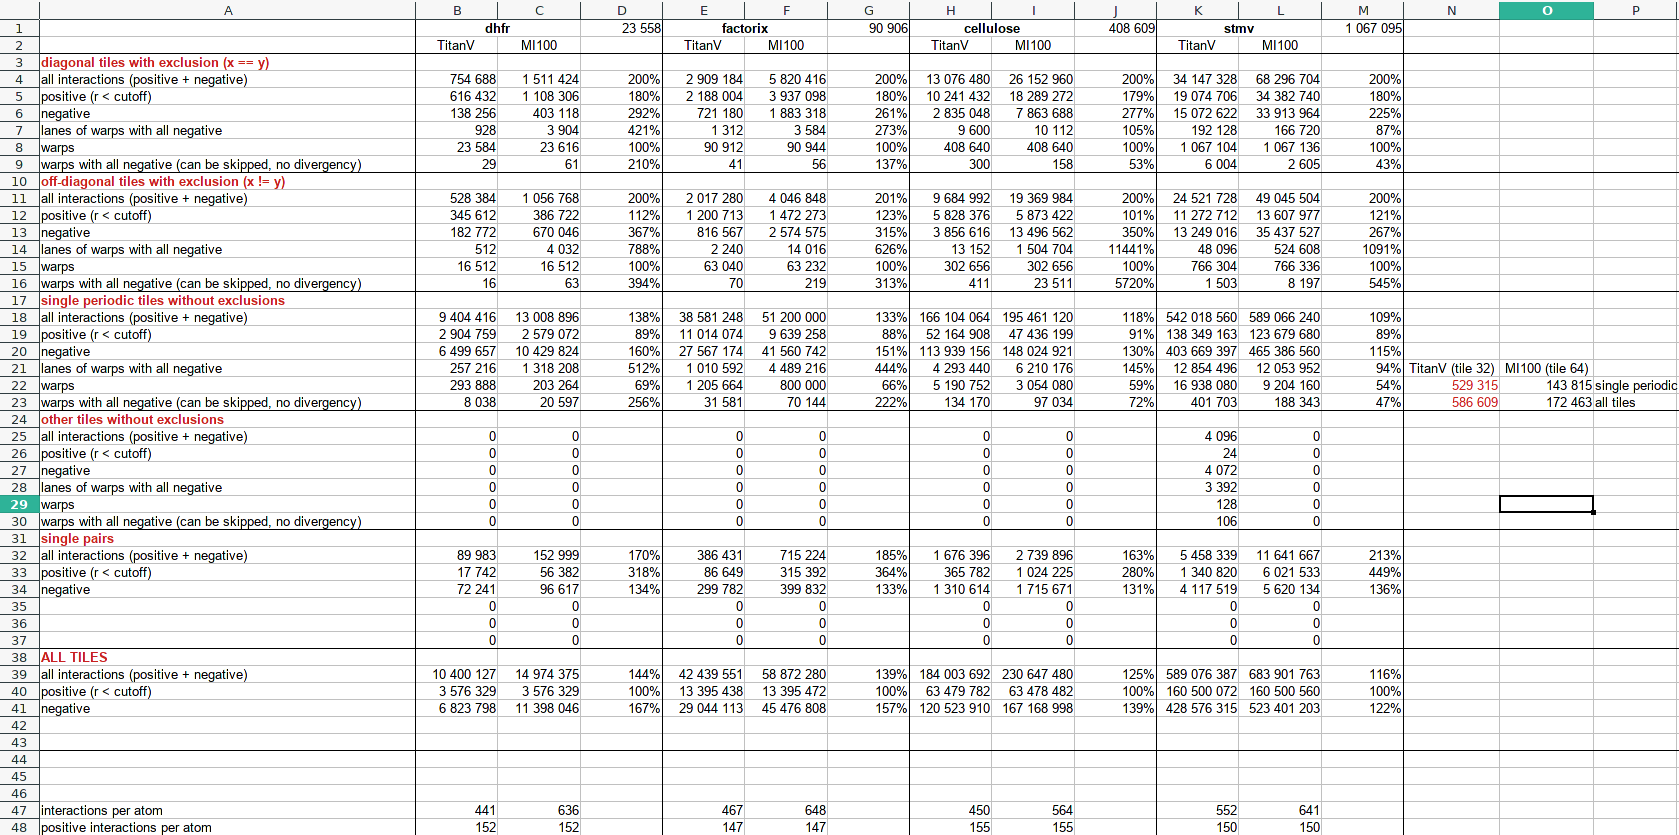
warps are tiles * tile size (i.e. the number of iterations of inner loops), that's why on AMD (MI100, HIP port) I have less warps/tiles for "single periodic tiles without exclusions", I use tile size of 64.
(MAX_BITS_FOR_PAIRS is 4)
I don't know if it will help you but here is the file:
2021-09-30-nonbonded-counters-2.xlsx
I hope everyone had a good New Years!
I hacked in an opportunistic check that avoids reloading the i-atom data if consecutive tiles corresponded to the same data, and experimented with disabling the single pair lists. Here are some kernel timings for STMV:
A40: Baseline: 11.64ms No Single Pair: 8.52ms No Single Pair & reusing: 7.28ms
A100: Baseline: 4.82ms No Single Pair: 4.40ms No Single Pair & reusing: 4.50ms
The reuse scheme adds some logic overhead which likely caused the regression on the A100; however, it made a difference on A40 which has a smaller L2 cache and slower memory. Disabling the single pairlist optimization seems to make a significant difference though; I imagine there is an optimal MAX_BITS_FOR_PAIRS value that depends on the system size and architecture. Perhaps we could fix the length of the single pair list and decrease MAX_BITS_FOR_PAIRS instead of reallocating singlePairs here:
https://github.com/openmm/openmm/blob/71d9bb13c9631755b14a08e26205fe85fccf7458/platforms/cuda/src/CudaNonbondedUtilities.cpp#L446-L452
Perhaps we could fix the length of the single pair list and decrease MAX_BITS_FOR_PAIRS instead of reallocating singlePairs here
What would be the reason for doing it that way? I think what really matters is which of these is faster: 1) computing 32 interactions with the fast code path, even though we know most of them are beyond the cutoff and will be zero, or 2) computing only one (or two, or three) interactions with the slow code path. I don't see what the size of the single pair list has to do with that?
Sorry I didn't fully explain the idea—I was thinking that the optimal approach between the two methods could change depending on if the single pair list had a high cache hit rate. I.e. if the single pair list largely stayed on-chip, it would be faster to have a higher MAX_BITS_FOR_PAIRS. But, if the kernel had to go off-chip to access the single pair list, it might be faster to use the other code path. The maximum size of the single pair list could be some fraction of the L2 cache size and determined at runtime.
Wouldn't reducing MAX_BITS_FOR_PAIRS reduce the cache hit rate in that case? When it has a higher value, you'll often get multiple threads within a single warp all processing interactions that involve the same atom. When you reduce it that won't be true anymore, so you'll rarely get cache hits.
and experimented with disabling the single pair lists
@dmclark17 Interesting - when you say disable the single pair list, do you mean some forces which should be calculated were skipped (just for benchmarking), or do you mean the single pairs ended up in tiles instead?
each 32x32 tile would seem to be able to calculate at least 32 arbitrary pairs :)
@peastman @dmclark17 One of the big issues here is the essentially 0% L1 cache hit rate. This is something I really don't get. The memory access pattern should be fairly local, if the tiles are sorted the right way.
Imagine a set of tiles for which both the row and column atoms are located within a single cube in space. The density of typical systems is pretty uniform at around 100 atoms/nm^3. If L1 cache is 192k, it should be able to fit 192e+3 / (7*4) = ~6800 atoms which is roughly a 68nm^3 cube (or 4x4x4nm). We also know that there is roughly 0.5 tiles per atom, and for a lot of atoms in the cube all of the atoms that can potentially interact with them would also be in the cube - for an atom on a cube face it is ~half of all interactions, for an atom in the middle it is all interactions, and in the exact corner 1/8th, but let's say it averages to about half. So a single SM can load 6800 atoms and then calculate something like 1700 tiles entirely from L1. This is an hypothetical L1 hit rate around 1 - 6800 / (1700*32*2) = 93%.
This is just a simple back of the envelope, but it shows the idea: if the work that SMs end up doing is localized in space, the cache hit rate can be very high. This must mean that somehow tiles from regions which are localized nearby in space generally end up on different SMs. I'm not sure how the tile list maps onto SMs (or even if there is any way to control that), but it seems that however it works, tiles which are adjacent in space mostly end up on different SMs and hence miss the cache. Some way to sort the tile list which explicitly tries to map 3d space locality onto SMs should be able to fix that.
(I know there are a lot of details the cube sketch above glosses over: the cube can sweep through the volume of the calculation incrementally, it wouldn't be reloaded from scratch every time so it would be more efficient; cubes on different SMs may have to overlap which is significantly less efficient; etc but most of the ways to ballpark this result in high hit rates).
Another issue (and maybe the thing that determines overall speed) is that the L2 hit rate is also surprisingly low. If forces were simply updated sequentially (with atomicAdd), the L2 hit rate would be 75%. Even if just 3 values (x, y, z forces) were always updated sequentially, the L2 hit rate should be around ~50%. The observed 36% is worse than the expected for updating 3 sequential values in an otherwise random pattern, which implies that cache lines frequently end up getting replaced in L2 even in the middle of updating successive x, y, z forces for a single atom.
The L2 caches on a lot of cards are big enough to fit the force for a lot of atoms - eg on the A10 benchmarked above, 6MB cache = forces for 250k atoms, and on A100, 40MB = forces for 1.6M atoms which is more than enough for the whole STMV system.
The reason I say this determines overall performance is because for large/huge systems like STMV, DRAM bandwidth is close to maxed out, and SMs are mostly idle - and most of the DRAM bandwidth (here 3GB out of 4.5GB/step) is used by atomicAdd calls (which miss the L2 most of the time). I think if we somehow managed to end up with most atomicAdd calls hitting the cache, the result would be on the order of a 3-4x overall speedup for this system.
I don't understand why the L1 hit rate is so tiny. I verified that for a large fraction of tiles, the atom block index is the same as the previous one, so there ought to be lots of opportunity for caching.
To process one tile, each thread needs to load the index of one atom, and position, charge, sigma, and epsilon for two atoms. That's 52 bytes per thread. It also loads the index, center, and size of an atom block, but those are the same for every thread, so it's only 36 extra bytes for the whole warp. The thread block size is 256. By my count, this adds up to 13600 bytes per thread block, which is just a small fraction of the L1 size. Even considering that multiple thread blocks may get scheduled on the same SM at the same time, it ought to fit without problem.
Of course, that assumes the cache stores exactly the data that's needed and nothing else. That isn't the case in practice. I believe cache lanes are 128 bytes? 32 of the atoms are continuous, so their data will be packed together in memory and no cache should be wasted for them. The other 32 are not continuous, though they will usually still be close together, so some cache will get wasted there.
Even given that, though, I don't understand why the L1 hit rate is less than 1%. It seems like it ought to be far higher. How can we determine what's going on?
Wouldn't reducing MAX_BITS_FOR_PAIRS reduce the cache hit rate in that case? When it has a higher value, you'll often get multiple threads within a single warp all processing interactions that involve the same atom. When you reduce it that won't be true anymore, so you'll rarely get cache hits.
Right—a higher MAX_BITS_FOR_PAIRS does seem like it should lead to more data reuse. I guess I was thinking the length of the singlePairs array itself could be causing the cache misses instead of the atom data. I can do some experiments regarding the max number of bits and the cache hit rate.
@aizvorski I set MAX_BITS_FOR_PAIRS to zero, so no interactions should have been excluded.
For reference, the profile indicated that there were 4 thread blocks active per SM. Interestingly, it seems like the shared memory configuration size is 100KiB even though the kernel is only using 2KiB per thread block. I believe this is reducing the size of the L1 cache per SM to 28KiB which would explain the low hit rate given the 13600 byte per thread block estimate. We can experiment with using the cuFuncSetCacheConfig to change the configuration to CU_FUNC_CACHE_PREFER_L1. There are some cache hint operators that we could experiment with as well: https://docs.nvidia.com/cuda/parallel-thread-execution/index.html#cache-operators.
I tested your idea with the DHFR PME benchmark on a Titan V, which has a similar cache architecture: 128K split between L1 and shared memory in a user configurable way. When I added the command
cuFuncSetCacheConfig(kernel, CU_FUNC_CACHE_PREFER_L1);
for computeNonbonded(), it actually got slower, dropping from 932 to 906 ns/day. Not what I expected!
The API documentation for that function notes,
Launching a kernel with a different preference than the most recent preference setting may insert a device-side synchronization point.
We're running PME on one stream and everything else on another stream. Perhaps the problem is that setting this configuration adds synchronization and prevents it from using the full GPU as effectively? To test this, I tried the RF benchmark which doesn't have the separate stream. On that one, setting the cache configuration maybe makes it a tiny bit faster (average over two runs increases from 1251 to 1259), though the difference is probably within the noise level.
Interesting—for small problems, I could see a device-side synchronization having a measurable impact on performance. We could try removing the cache configurations from some of the PME kernels here. I can generate some Nsight System timelines to see if the cache configurations are impacting the overlap.
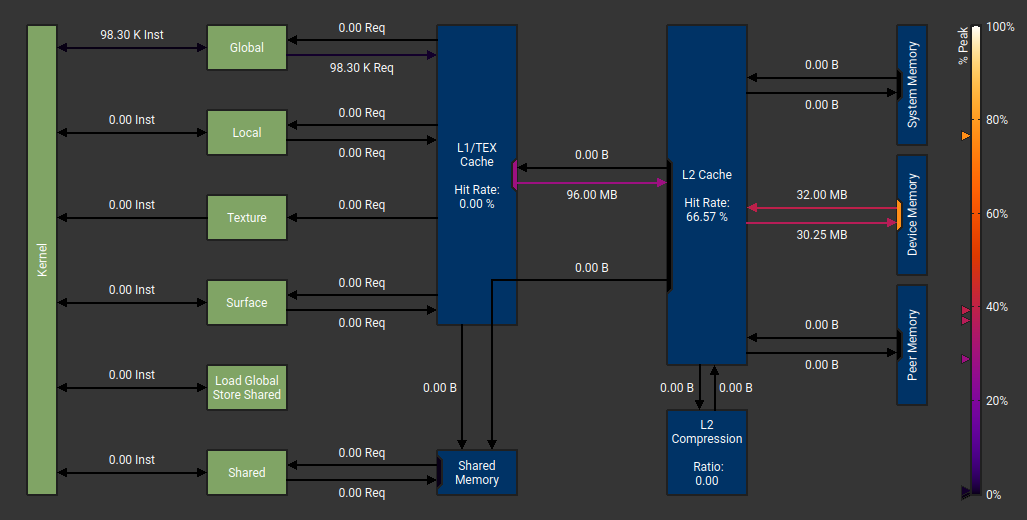
For STMV, I found that the CU_FUNC_CACHE_PREFER_L1 setting brings the shared memory size to 16KiB, leaving 112 KiB for L1. This brings the L1 hit rate from 0.67% to 4.78% with max bits of 4. Without the single pair list, it brings the hit rate from 0.70% to 11.34%. There are minor performance improvements to the kernel in both cases as well. It still seems like the hit rate is pretty low.
I also found that the single pair list for STMV and a max bits of 4 is 19 768 187 elements long—or about 150MiB. This is too large to fit in the cache and may be polluting the caches with values that are only read once per timestep. @ex-rzr for the Titan V measurements you posted, was max bits 2? I think that is the default for pre-Ampere architectures
I also found that the single pair list for STMV and a max bits of 4 is 19 768 187 elements long—or about 150MiB. This is too large to fit in the cache and may be polluting the caches with values that are only read once per timestep. @ex-rzr for the Titan V measurements you posted, was max bits 2? I think that is the default for pre-Ampere architectures
Yes, you're right. Sorry for confusion. MAX_BITS_FOR_PAIRS was 4 on MI100, on TitanV it's indeed 2: https://github.com/openmm/openmm/blob/master/platforms/cuda/src/CudaNonbondedUtilities.cpp#L501