alerting-kibana-plugin
 alerting-kibana-plugin copied to clipboard
Published
20 hours ago •
 opendistro-for-elasticsearch
Indexed fields do not show up in OVER option in Create Monitor
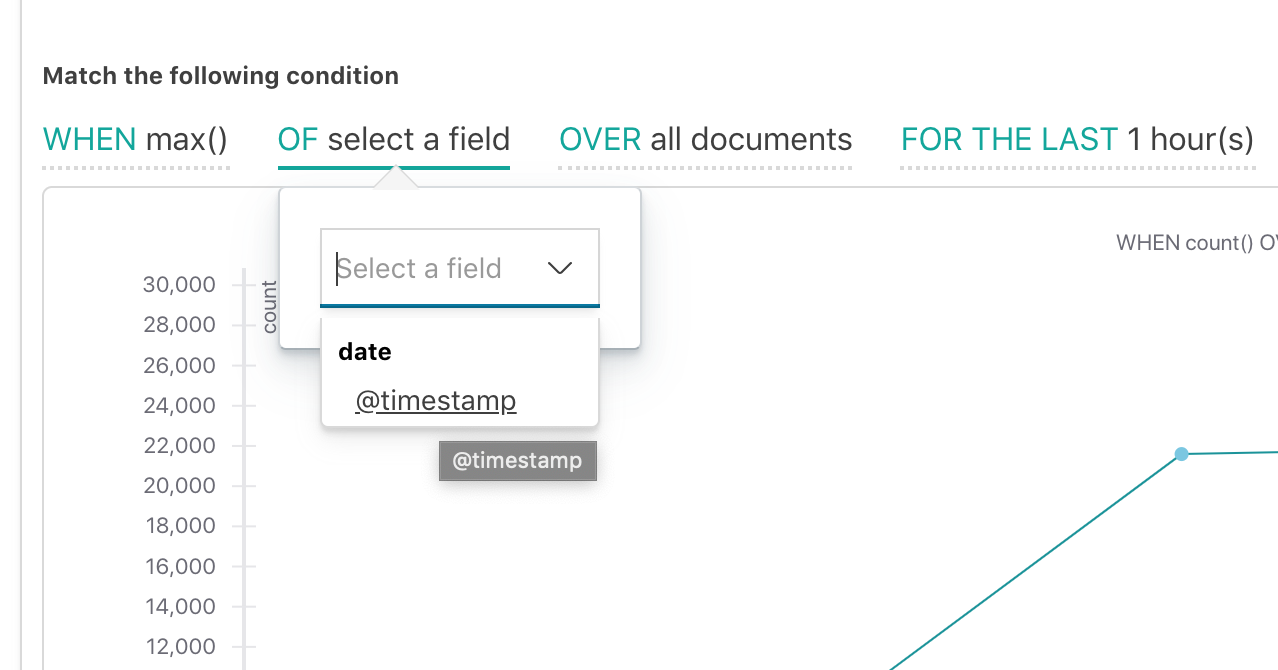
I have an Elastic Search cluster in AWS Ireland, version 6.2.3. When attempting to build a HTTP status 500 error monitor in the Alerts section, there is no way to select a field to filter on when defining a monitor using visual graph.
The index pattern specified matches the index pattern in Settings.
All Documents returns the expected number of documents.
See screenshot.

When using max, sum or other function that uses a field, there are no fields shown either.
The underlying issue seems to be that indexed fields are not being picked up by the Alerting plugin for some reason.