Monitoring Kubecost?
How it is recommended to monitor that the cost model is working as expected? For example, this page is highly valuable for monitoring:
 But it's not exposed as metrics...
How will you recommend me to monitor this product?
But it's not exposed as metrics...
How will you recommend me to monitor this product?
Hi Omer, good question. What exactly are you looking to monitor? If cost model metrics are being collected? Or that the cost model is correctly able to serve data? Or something else?
I'm looking to monitor that cost model is working correctly, and I can trust the data when I'll need it.
The best approach to do this continuously is likely to use the aggregated cost model API. This reports the same data as the Kubecost frontend and would go above and beyond what the Prometheus diagnostic test does.
How would you recommend using it? Getting aggregation for the last 5 minutes?
Depends exactly what you are looking to confirm, but you could do a short time window, e.g. 1-5 minutes, like that!
Understood. Is there any chance to implement it as Prometheus metric? Will be a lot easier to monitor :)
Yep, this can be accomplished! You would need to monitor several metrics for this to be complete, or you could do the simple test that our /metrics is UP.
Which metrics should I use?
Monitoring the /metrics (or just using up metric) just ensure that the service is running. no?
Depends on your cluster, e.g. using GPUs, etc. But monitoring a subset of these metrics is likely best: https://github.com/kubecost/cost-model/blob/master/PROMETHEUS.md#available-metrics
I ended up using the following query:
absent(node_total_hourly_cost) == 1
What do you think about adding a prometheus rule to the chart?
Yeah, we can explore adding something like this for you if it would be helpful and our product is overall a fit for you!
@omerlh are you still using the product? We’re reviewing priorities for our next sprint. Would you want to discuss soon?
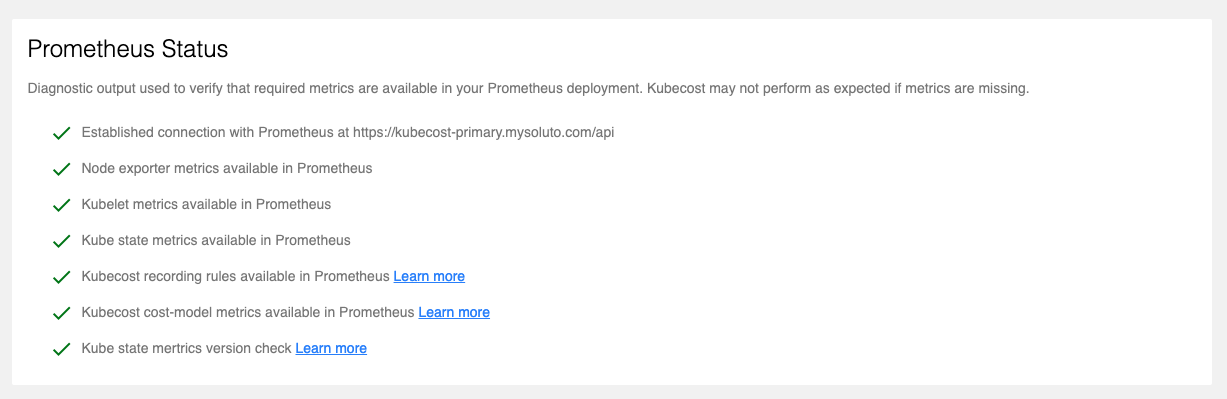
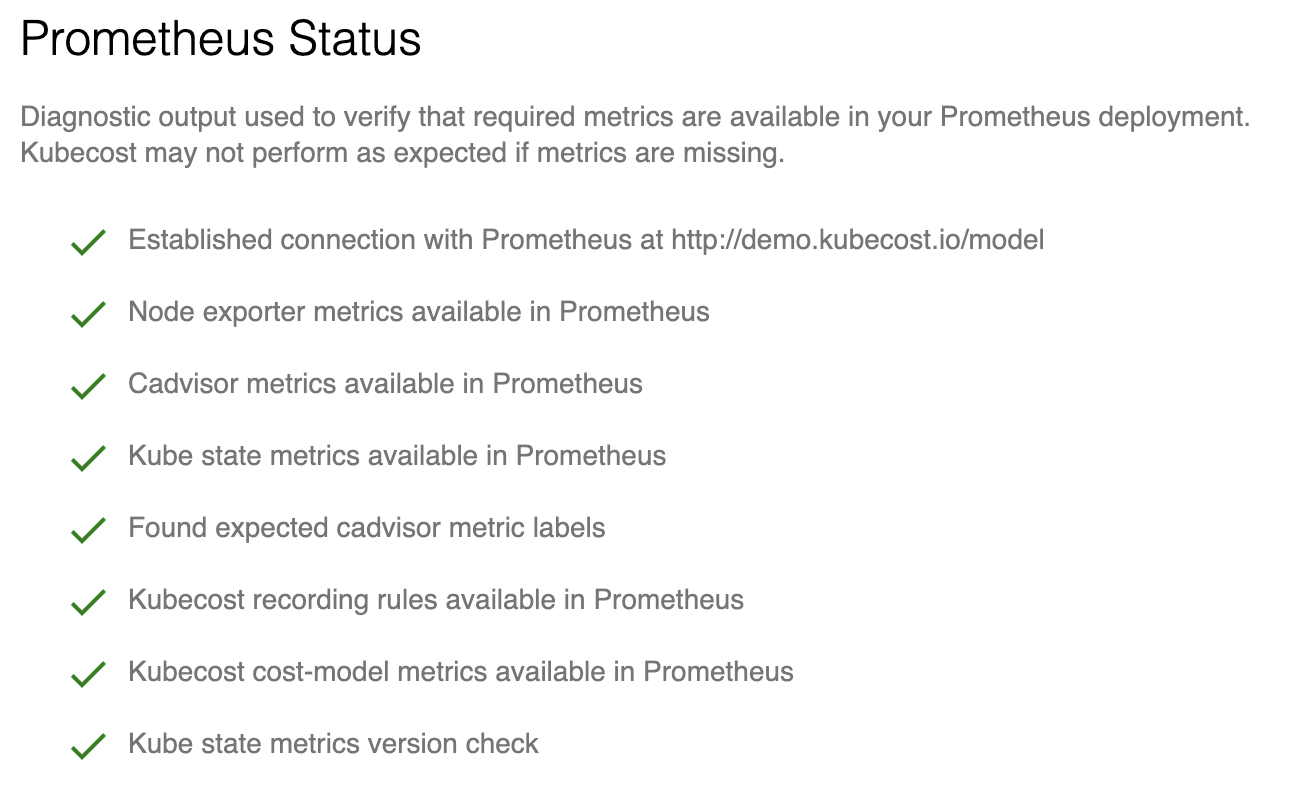
Hey the checks appearing on diagnostics.html would be great to have in metrics. I am happy to contribute this if the maintainers think that this feature is worth having in upstream.
Use-case: Let's say I screw up my IAM Policy, and cost-model is not able to access the spot data feed anymore or my athena table name in config is messed up due to incorrect value during an update. I would like to get alerted for this. For open-source users all the checks in form of metric would allow them to use the tools of their choice to create these monitors and alert to the their preferred channels based on internal SLAs
@smitthakkar96 any other checks in diagnostics.html that would be most helpful? All of the check below currently have underlying Prometheus measures that you can monitor.
I do agree adding one for cloud integrations would be interesting.
Maybe it would be helpful to just document what these prometheus monitoring queries are? @kbrwn this will also pertain to monitoring the hosted solution...want to take a first pass at that documentation?
@dwbrown2 @AjayTripathy It is not very clear which queries from cost-analyzer-frontend repo which queries are made to make these checks. Maybe I am just looking at the wrong file? queries.js?
There are multiple issues about this topic. I agree we can document right now with the existing metrics some tips for monitoring. Although I conclude the several issues about this topic is because users want metrics related to the specific performance and actions of kubecost. It seems like we just ask the same questions on these issues over and over instead of taking initiative. A user may not be able to articulate exactly what they want to monitor. Users may not know the important components of kubecost. Here are some examples of metrics for monitoring we could provide:
- histogram metric for frontend response times and request
- histogram metric for etl build times
- histogram metric for api queries time
- counter metric for api queries
- counter metrics for 400/500 errors
- gauge metric for number of concurrent requests
- gauge metric for # of green etl days
- counter metrics for queries to prometheus
- histogram/summary metric for prometheus query response times
- counter metric for # of metrics produced by kubecost pod
- counter metric for failed cloud cost report queries
We are interested in the entire list @kbrwn posted, with a focus on:
- histogram metric for frontend response times and request
- histogram metric for API response times and request
- histogram metric for etl build times
- histogram metric for etl file sizes
- gauge metric for # of green etl days
- gauge metric for # of NON-green etl days
This is great, thanks for sharing @MrColeC! We have this on the docket for our upcoming release (1.94). We'll start to review next week and will find owners soon after.
cc @AdamStack18
Close in favor of https://github.com/kubecost/docs/issues/304
@AjayTripathy or @dwbrown2, Could you add me to the Opencost organization when you have time? Need permissions to close out and label issues.
This issue is being closed because it may not be relevant to the OpenCost project and appears stale. If you feel this was closed in error, please open a new OpenCost issue with updated details or if it is still relevant for Kubecost please open an issue with Kubecost Support.