gatekeeper
 gatekeeper copied to clipboard
Gatekeeper high response time after adding --max-serving-threads and GOMAXPROCS
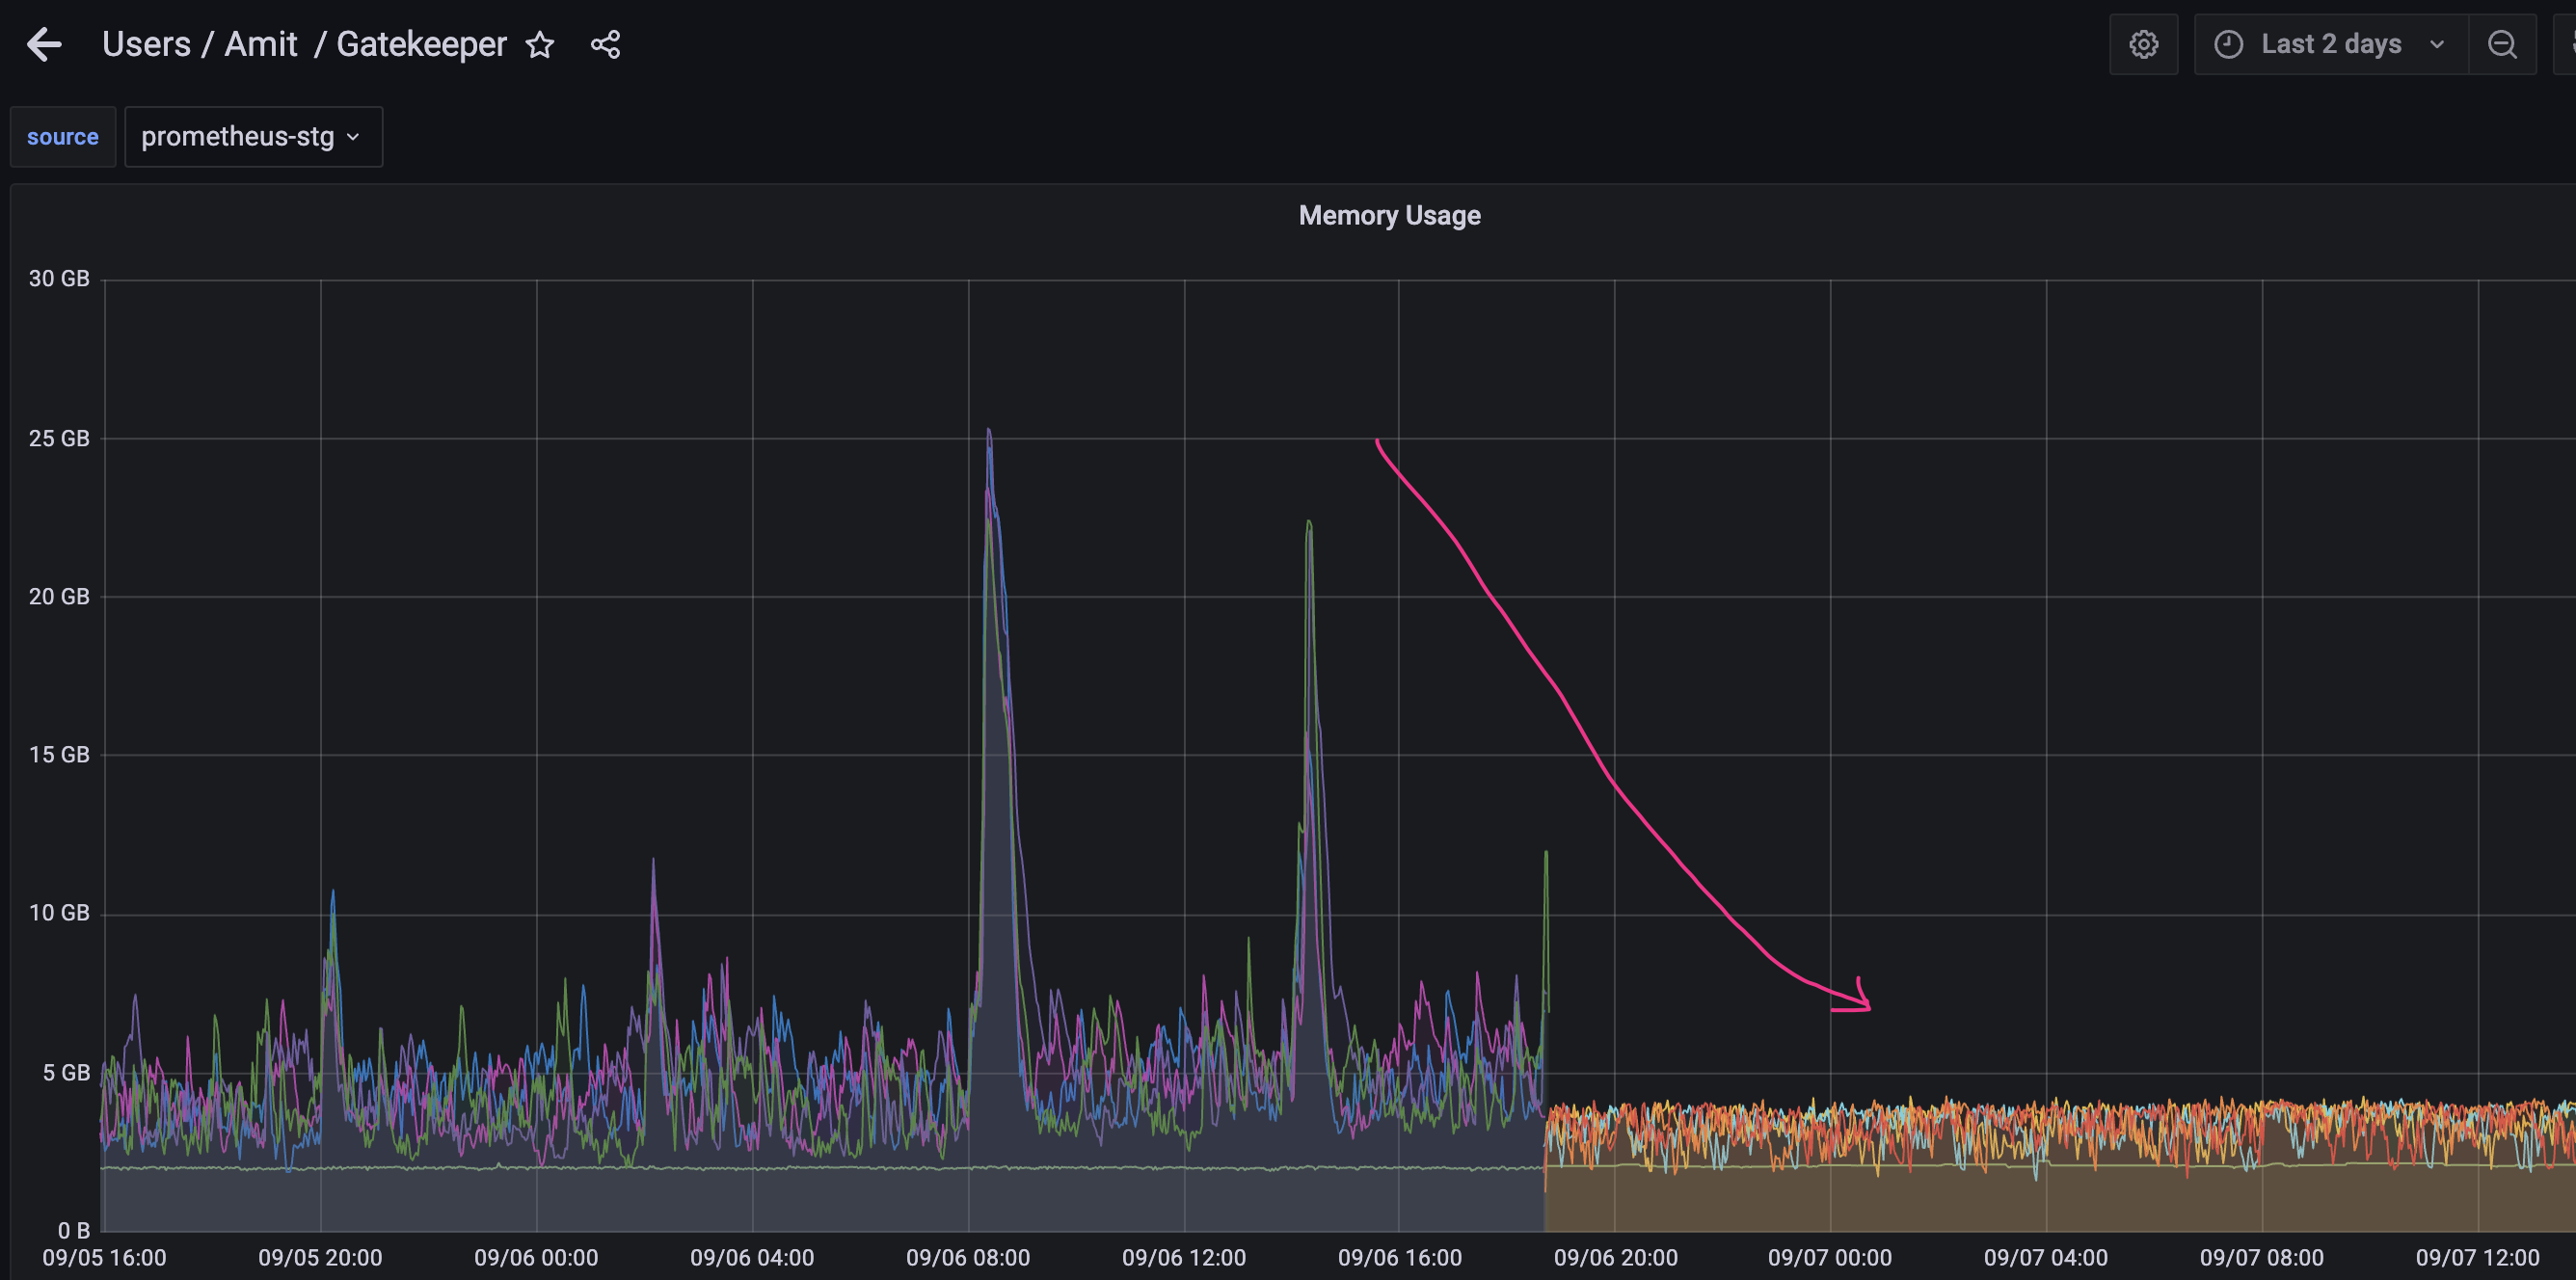
What steps did you take and what happened: Gatekeeper was consuming a lot of memory(around 20GB during peak hours) and Gatekeeer controller manager pods were OOMing. to fix this issue, we applied the fix mentioned here https://github.com/open-policy-agent/gatekeeper/issues/1907
- added --max-serving-threads flag to max cpu count(3 in our case)
- added GOMAXPROCS to max cpu(3 in our case).
This indeed brought down the memory consumption and no OOMing restarts.
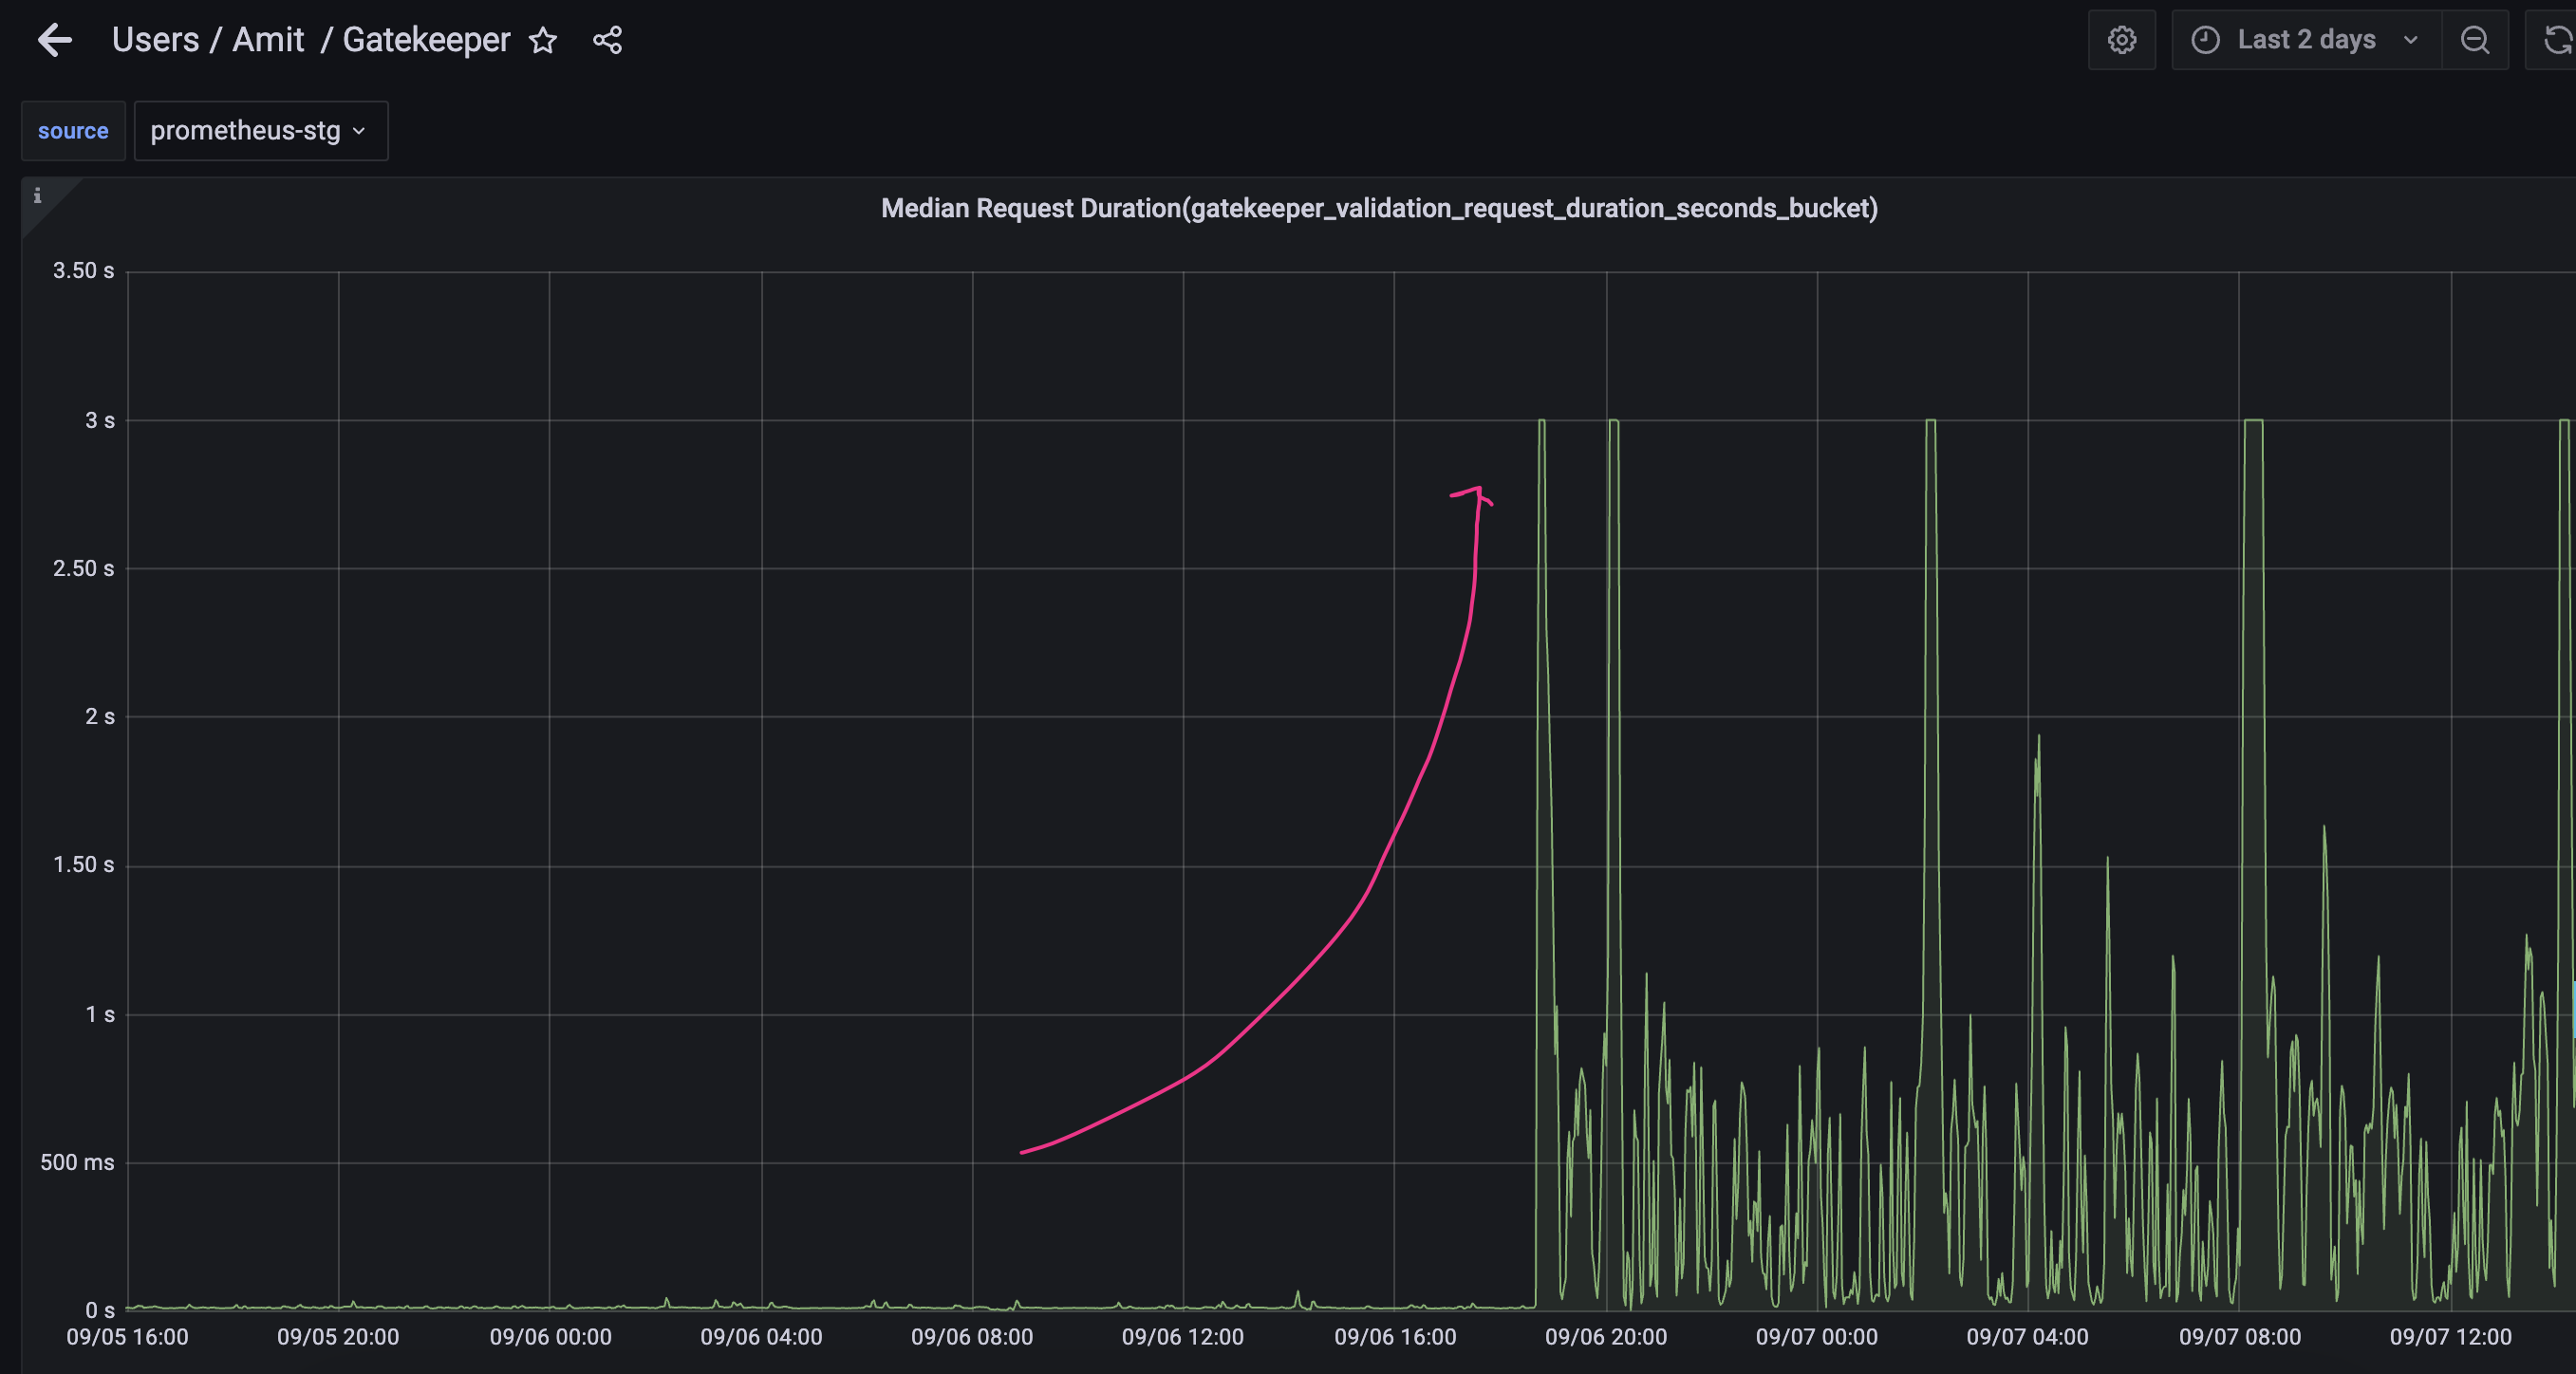
However we observed that the web-hook response time[gatekeeper_validation_request_duration_seconds] has gone up very high,around 3 seconds, compared to around 50ms before this fix.
What did you expect to happen: memory/CPU under control without compromising webhook response time.
Anything else you would like to add: We have around 74 contraints and 32 templates.
Environment:
- Gatekeeper version: 3.8.1
- Kubernetes version: (use
kubectl version): 1.20
What kind of QPS is G8r getting?
My first instincts are:
- The footprints need to be larger (more pods and/or larger pods)
- Further tuning might be able to squeeze more out of the same footprint by raising max-serving-threads and GOMAXPROCS over the cpu limit. I'd try raising max-serving-threads first.
Do you have any constraints that use blocking calls (e.g. anything that uses http.send() or external data)?
Hi @maxsmythe, Thank you for your reply. Sorry, I am not sure how to get QPS for G8r. I tried to find various prometheus metrics but unfortunately I don't find QPS for G8r.
- Yes, the footprints is large(we run one cron job that creates around 30 pods) when we see high response time from G8r.
- I tried to increase max-serving-threads to 7, this did not help.
- I tried to increase GOMAXPROCS to 7, this also did not help.
- my current configuration is : max CPU=5, max-serving-threads=7, GOMAXPROCS=7
unfortunately, this configuration did not help.
One possible workaround for now is to disable the cron job, but this will only fix the problem temporarily. We are expecting workload to increase in the future and we would like to scale G8r for the larger footprint.
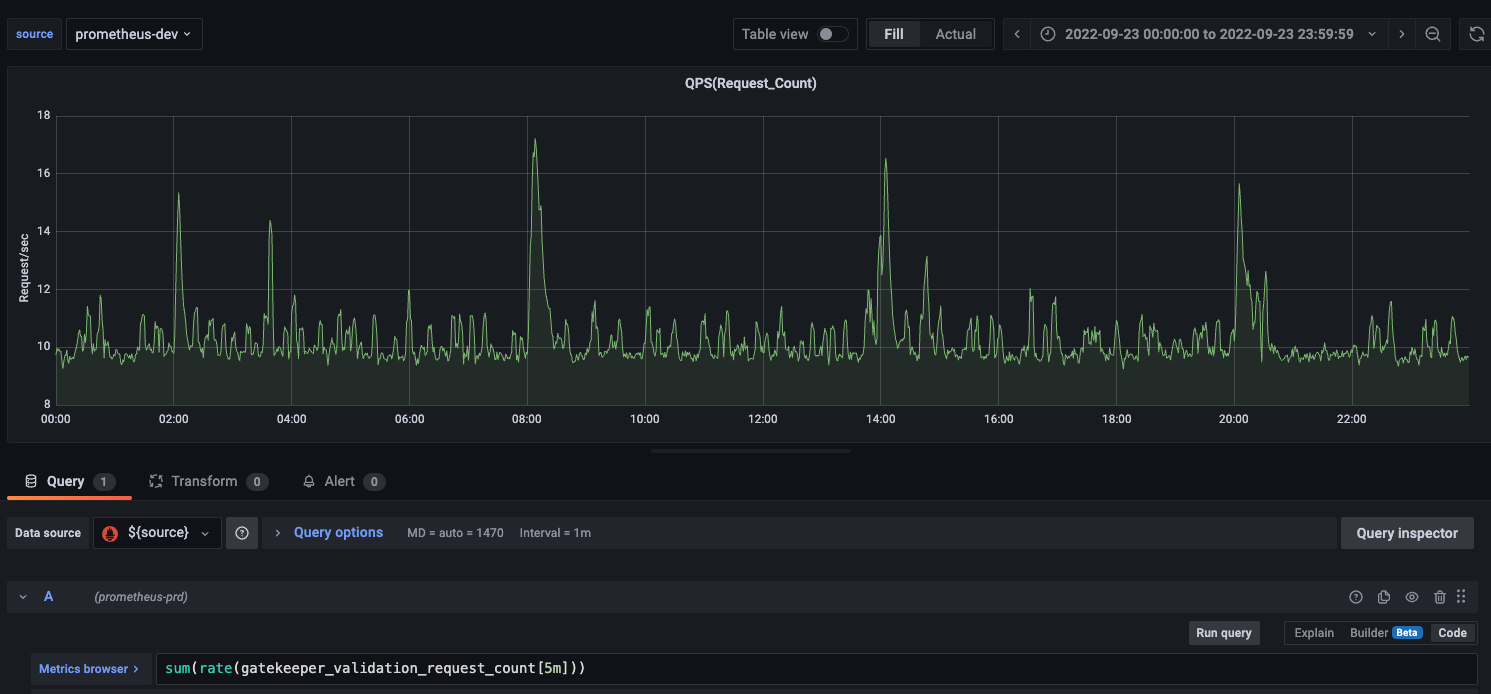
The QPS would be inferred by analyzing the gatekeeper_validation_request_count metric (calculating delta and dividing by the sampling interval). It looks like you have a dashboard system, does it allow graphing those kinds of expressions?
Here is a stack overflow answer that seems on-point:
https://stackoverflow.com/questions/64043624/how-prometheus-statistics-qps-in-multi-process
Knowing this number would help to figure out if the QPS served/pod seems reasonable.
You can definitely scale Gatekeeper by adding pods, this section of the doc talks about the implications of that: https://open-policy-agent.github.io/gatekeeper/website/docs/failing-closed#impact-of-scaling-nodes
you mention you have 32 templates... are any of them referential (i.e. do they have data.inventory in their Rego source code)?
Thank you @maxsmythe
-
QPS is around 17 during peak hours. its around 10 during normal hours.
-
Yes, we are using data.inventory in Rego sources, around 10-15 templates are using
data.inventory -
I am adding other gatekeeper monitoring metrics as well- Gatekeeper-grafana-1.pdf Gatekeeper-grafana-2.pdf Gatekeeper-grafana-3.pdf
-
I also noticed that gatekeeper controller pods are flooded with this error-
{"level":"error","ts":1664181904.8118215,"logger":"webhook","msg":"error executing query","hookType":"validation","error":"serving context canceled, aborting request","stacktrace":"sigs.k8s.io/controller-runtime/pkg/webhook/admission.(*Webhook).Handle\n\t/go/src/github.com/open-policy-agent/gatekeeper/vendor/sigs.k8s.io/controller-runtime/pkg/webhook/admission/webhook.go:146\nsigs.k8s.io/controller-runtime/pkg/webhook/admission.(*Webhook).ServeHTTP\n\t/go/src/github.com/open-policy-agent/gatekeeper/vendor/sigs.k8s.io/controller-runtime/pkg/webhook/admission/http.go:99\ngithub.com/prometheus/client_golang/prometheus/promhttp.InstrumentHandlerInFlight.func1\n\t/go/src/github.com/open-policy-agent/gatekeeper/vendor/github.com/prometheus/client_golang/prometheus/promhttp/instrument_server.go:40\nnet/http.HandlerFunc.ServeHTTP\n\t/usr/local/go/src/net/http/server.go:2047\ngithub.com/prometheus/client_golang/prometheus/promhttp.InstrumentHandlerCounter.func1\n\t/go/src/github.com/open-policy-agent/gatekeeper/vendor/github.com/prometheus/client_golang/prometheus/promhttp/instrument_server.go:117\nnet/http.HandlerFunc.ServeHTTP\n\t/usr/local/go/src/net/http/server.go:2047\ngithub.com/prometheus/client_golang/prometheus/promhttp.InstrumentHandlerDuration.func2\n\t/go/src/github.com/open-policy-agent/gatekeeper/vendor/github.com/prometheus/client_golang/prometheus/promhttp/instrument_server.go:84\nnet/http.HandlerFunc.ServeHTTP\n\t/usr/local/go/src/net/http/server.go:2047\nnet/http.(*ServeMux).ServeHTTP\n\t/usr/local/go/src/net/http/server.go:2425\nnet/http.serverHandler.ServeHTTP\n\t/usr/local/go/src/net/http/server.go:2879\nnet/http.(*conn).serve\n\t/usr/local/go/src/net/http/server.go:1930"}
As an experiment (if you are able to do this), does disabling the sync config fix the issue?
I'm wondering if it's the lock contention issue addressed here:
https://github.com/open-policy-agent/gatekeeper/pull/2272
Hi @maxsmythe unfortunately disabling sync config is not an option for us. what we are thinking now is to focus on optimising our cron jobs and see if that improves performance because only during cronjob runs we face high latency from G8r.
Thank you
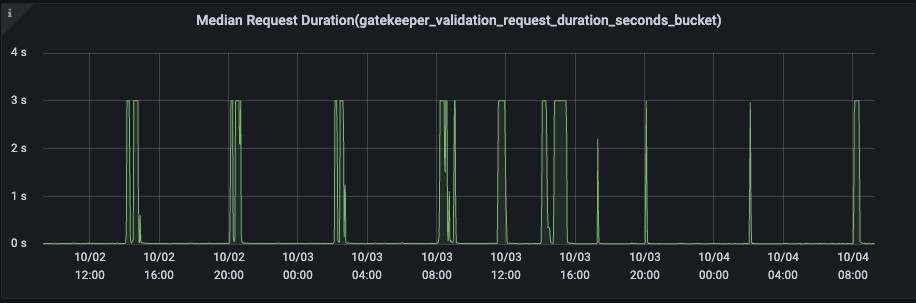
one interesting and intriguing thing I noticed is that latency- Median Request Duration(gatekeeper_validation_request_duration_seconds_bucket) does not go beyond 3 seconds.
Is this because we have set timeoutSeconds: 30 ?
apiVersion: admissionregistration.k8s.io/v1
kind: ValidatingWebhookConfiguration
metadata:
  name: gatekeeper-validating-webhook-configuration
webhooks:
- failurePolicy: Fail
  name: validation.gatekeeper.sh
  timeoutSeconds: 30
  rules:
  - apiGroups:
    - '*'
    apiVersions:
    - '*'
    operations:
    - CREATE
    - UPDATE
    - DELETE
    resources:
    - '*'
3 seconds is the current maximum latency the distribution is configured to observe:
https://github.com/open-policy-agent/gatekeeper/blob/ab939829c8296634149eb68cb030d9fc8b6d2a21/pkg/webhook/stats_reporter.go#L86-L92
If #2272 isn't fixing the performance issues, I also have hopes that https://github.com/open-policy-agent/frameworks/pull/252 will help.
Thank you for your inputs @maxsmythe, highly appreciate it. we are currently fine-tuning our cronjobs. seems this fix was just released in 3.9.1, we will wait for n-1 release before we upgrade it in production.
I see you re-opened the issue, is there anything outstanding that you need?
This issue has been automatically marked as stale because it has not had recent activity. It will be closed in 14 days if no further activity occurs. Thank you for your contributions.