flow-go
 flow-go copied to clipboard
Localnet Inclusion Fees measurements
Problem Definition
This build on https://github.com/onflow/flow-go/issues/2785
Make some preliminary measurements of transaction saturation points depending on the 5 different parameters:
- Script byte size
- Total Arguments byte size
- Authorizers count
- Payload signatures count
- Envelope signatures count
On localnet.
By doing this on localnet we can se if the saturation point depends on these parameters at all, and if the relation is approximately linear.
Definition of Done
- Fill the following table:
| Script byte size | Total Arguments byte size | Authorizers count | Payload signatures count | Envelope signatures count | Max TPS |
|---|---|---|---|---|---|
| min | min | min | min | min | |
| max | min | min | min | min | |
| min | max | min | min | min | |
| min | min | max | min | min | |
| min | min | min | max | min | |
| min | min | min | min | max | |
| max/2 | min | min | min | min | |
| min | max/2 | min | min | min | |
| min | min | max/2 | min | min | |
| min | min | min | max/2 | min | |
| min | min | min | min | max/2 | |
| max/2 | max/2 | min | min | min | |
| min | max/2 | max/2 | min | min | |
| min | min | max/2 | max/2 | min | |
| min | min | min | max/2 | max/2 | |
| max/2 | min | min | min | max/2 |
- Also record the total byte size of the transaction at each measurement
- OPTIONAL: Observe if the bottleneck is always the same part of the system and which part is it?
collected localnet metrics with preset tx sizes for stable peak TPS, and here are some early observations.
Test Machine
Apple M1 Pro\16GB mem
Metrics Collection Procedure
- close as many unrelated processes as possible
rm -rf data profile trie bootstrapunderflow-go/integration/localnetmake init->make start- launch loader with
const-execas type, setting different max tx size. e.g.go run --tags relic ../loader -log-level info -tps 100 -tps-durations 800s -load-type const-exec -const-exec-max-tx-size 750 - Check sealed tx rate (a mirror local grafana to https://dapperlabs.grafana.net/d/PkvVJj4Mz/mainnet-general?orgId=1&refresh=10s&viewPanel=162) and get the stable peak TPS
Scope
- only total tx size are considered for now (various params like size of tx arg, # of authorizers etc. will be explored next)
- Q3 above
Observe if the bottleneck is always the same part of the system and which part is it?will be explored next
Metrics data collected https://docs.google.com/spreadsheets/d/1eCH67Gmf9bfOHpyIghyCf8yR72aWt8D2j_OEzB8jOB4
Observations
- Peak TPS possible on localnet on the test machine is roughly 90
- max tx size that localnet can handle is about 150000+B. Larger tx will crash the localnet processes
- With given tx total size, overly high TPS from loader can decrease the peak TPS from localnet. Excessive TX input can somehow occupy some resources(memory?) from localnet thus the performance of localnet can be impacted.
- Total Tx Size vs Stable Peak TPS does not seem to form a linear correlation, and they mostly form an Inverse relation. It seems to be aligned with intuition of this calculation: (fixed avail computation resources / avg size of tx)
Using
scipy.optimize.curve_fitwe can get:
Misc Thoughts Seems tx comment has been passed along from Access Node until Execution Nodes. A potential optimization that can save unnecessary network traffic is to remove tx comments at Access Node. To be discussed.
Collected TPS metrics with various 1) # of authorizers; 2) # of keys of payer; 3) size of tx arg. Raw data is in https://docs.google.com/spreadsheets/d/1eCH67Gmf9bfOHpyIghyCf8yR72aWt8D2j_OEzB8jOB4/edit#gid=793558270
Observations:
- Size of Tx arg does not impact TPS. It makes sense because as long script\tx code is empty, it is no-op.
- The more the # of authorizer is, the lower the sealed tx TPS is. So does # of keys of payer, but the impact of # of authorizer is bigger than # of keys of payer.
Update: discussed above information with @janezpodhostnik:
- We will need to collect similar metrics from Benchnet, which is closer to real production env.
- After above is done, we will think about the math equation to code
- for tx\script compaction optimization: it is not viable at least for now bcz tx signature depends on the original tx\script code, also users will need to read their own code after publishing.
- for observability: follow @simonhf 's instruction to get Jaeger spans on localnet. But a good-to-have long term solution will be a Grafana diagram showing actual tx time cost breakdown info.
- mid\long term goals: make coefficients of the equation self-adjustable.
@bluesign let me put the raw metrics here:
| Total Tx Size (bytes) | sealed tx rate |
|---|---|
| 390 | 90 |
| 500 | 90 |
| 750 | 88 |
| 1000 | 85 |
| 2000 | 75 |
| 5000 | 40 |
| 7500 | 25 |
| 10000 | 20 |
| 20000 | 15 |
| 50000 | 6 |
| 75000 | 3 |
| 100000 | 2 |
| 125000 | 2 |
| 150000 | 2 |
| Total Tx Size - 5000B | sealed tx rate |
|---|---|
| auth1-key2-arg1000 | 40 |
| auth1-key2-arg2000 | 40 |
| auth1-key2-arg4000 | 40 |
| auth1-key2-arg1000 | 40 |
| auth10-key2-arg1000 | 37 |
| auth20-key2-arg1000 | 35 |
| auth30-key2-arg1000 | 32 |
| auth40-key2-arg1000 | 30 |
| auth46-key2-arg1000 | 27 |
| auth1-key2-arg1000 | 40 |
| auth1-key25-arg1000 | 37 |
| auth1-key50-arg1000 | 35 |
Updates on benchnet metrics collection:
I've been following runbook here to setup and run benchnet for const-exec type of load testing, hoping to collect meaningful metrics, but unfortunately there seems to be too much noises with our current benchnet default settings mentioned in the doc. For example, tx size 1000B and 5000B all had TPS wiggling between 15-20. Tried different type of GCP instance type (highcpu, highmem, etc.), plus running loader from my local laptop, all gave similar unstable metrics.
It might be some configuration of benchnet to be tuned, but it does require extra time and effort. Since what all we need is some metrics closer to mainnet, so instead of spending more time on figuring out benchnet setting, I'd recommend starting to collect related metrics (tx size, # of authorizers, # of payer signatures etc.) from mainnet, to get real metrics. Though the concern will be the turnaround time of doing this, considering our spork practices.
@janezpodhostnik
In terms of the instability of TPS metrics from benchnet, there are more observations: https://www.notion.so/dapperlabs/2022-Aug-9-v0-27-1-Benchmark-30165199234c462ba699da42ecccf72f#03fad5854ae641f4a029523f979dfa36 by @zhangchiqing and https://axiomzen.slack.com/archives/C015G65HR2P/p1660707233633889 by @simonhf
Collected same set of metrics from canary and ran a couple of BigQueries to get more insights.
TLDR:
-
Metrics data (stable peak sealed TPS) from canary is aligned with what we found out from localnet. The metrics is in Inverse correlation with the total size of one tx. Raw metrics data:
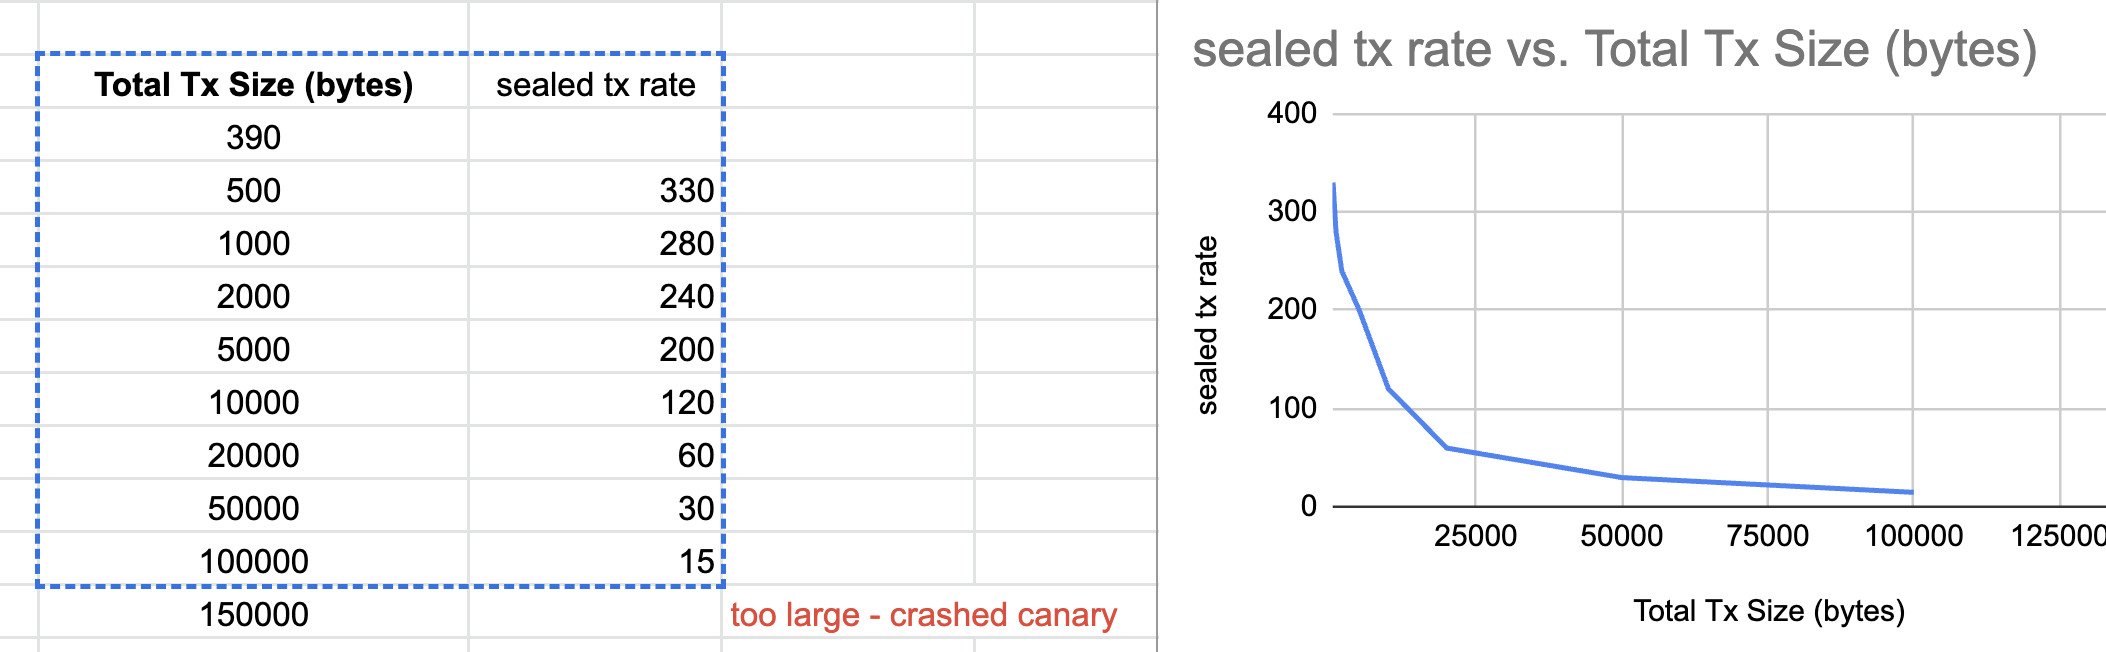
-
Number of authorizers, or number of keys of payer, did have impact (roughly linear) to the metrics with the fixed size of tx. However according to our BigQuery results (as below), majority of the tx have <=10 authorizers. So it might be appropriate to ignore the number of authorizers from our equation (to be discussed)
