unblob
 unblob copied to clipboard
Benchmark handlers
By default all tests will run as before. There is no impact on their performance.
To benchmark e.g. all compression handlers, run the following command:
poetry run pytest -k "test_all_handlers[compression." --no-cov --benchmark-enable --benchmark-histogram
By default all time unit will be scaled to represent throughput in
MiB/s. Unfortunately pytest-benchmark doesn't really support that
mode of operation so there is some hackery involved to do so.
Output of the above example should look like this:
--------------------------------------------------------------------------------------------------- benchmark: 8 tests --------------------------------------------------------------------------------------------------
Name (time in s)                                          Min                 Max                Mean            StdDev              Median               IQR            Outliers       OPS            Rounds  Iterations
-------------------------------------------------------------------------------------------------------------------------------------------------------------------------------------------------------------------------
test_all_handlers[compression.lz4.lz4_skippable]      31.3502 (>1000.0)   57.1229 (>1000.0)   35.8496 (>1000.0)  0.0005 (1.78)      33.9003 (>1000.0)  4.5031 (>1000.0)       6;3    0.0279 (0.00)         50           1
test_all_handlers[compression.lz4.lz4_legacy]          0.9306 (288.19)     1.7924 (304.65)     1.0922 (295.80)   0.0008 (2.74)       0.9952 (285.02)   0.1463 (>1000.0)       8;8    0.9156 (0.00)         50           1
test_all_handlers[compression.lzo]                     0.8415 (260.61)     1.1408 (193.90)     0.9310 (252.13)   0.0008 (2.59)       0.8976 (257.09)   0.0568 (399.70)      11;10    1.0741 (0.00)         50           1
test_all_handlers[compression.xz]                      3.5616 (>1000.0)    4.3744 (743.50)     3.7427 (>1000.0)  0.0003 (1.0)        3.7306 (>1000.0)  0.0566 (398.40)        8;7    0.2672 (0.00)         50           1
test_all_handlers[compression.bzip2]                   5.8341 (>1000.0)    6.5419 (>1000.0)    6.0760 (>1000.0)  0.0003 (1.11)       6.0609 (>1000.0)  0.1395 (981.76)       13;3    0.1646 (0.00)         50           1
test_all_handlers[compression.lz4.lz4_default]         0.8940 (276.88)     1.3362 (227.12)     0.9618 (260.47)   0.0016 (5.58)       0.9341 (267.53)   0.0569 (400.19)        6;4    1.0398 (0.00)         50           1
test_all_handlers[compression.lzma]                    3.7157 (>1000.0)    4.4260 (752.28)     3.8710 (>1000.0)  0.0008 (2.81)       3.8208 (>1000.0)  0.1100 (774.20)        6;6    0.2583 (0.00)         50           1
test_all_handlers[compression.lzh]                   193.6711 (>1000.0)  258.6279 (>1000.0)  201.6275 (>1000.0)  0.0051 (17.49)    196.9241 (>1000.0)  8.5945 (>1000.0)       4;4    0.0050 (0.00)         50           1
-------------------------------------------------------------------------------------------------------------------------------------------------------------------------------------------------------------------------
It will also output a graph like this (in reality it would be an interactive SVG, but it is unsupported by GitHub). Keep in mind, that the time axis contains throughput so the higher, the better:
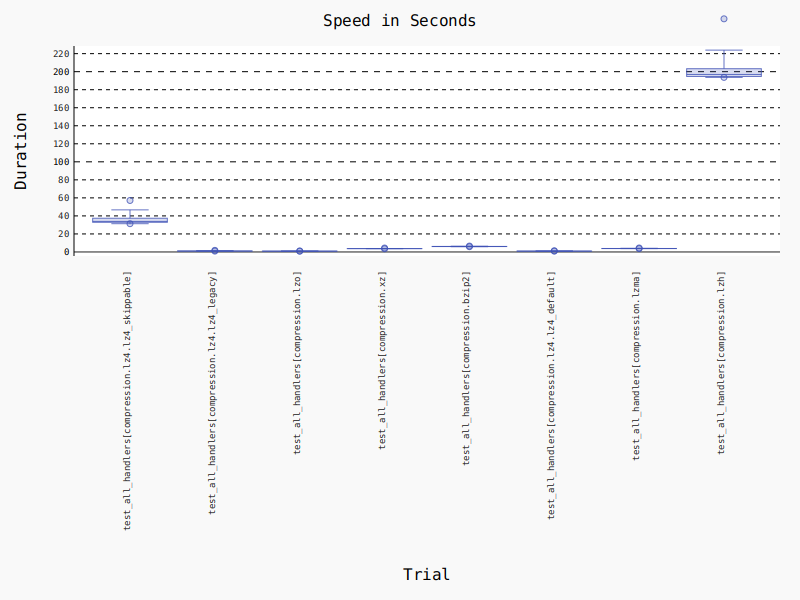
Unfortunately, the input data is varying greatly in entropy and size so it may not be suited for such comparisons. We could either create a separate perf-test file-set or replace the current very small files with bigger ones.
This is a really interesting idea. Would it be possible to enforce that a test fails if throughput is below a certain ratio ? Something we might add in the future to make sure all our handlers are sufficiently fast.
It's hard to measure that properly because we don't have performance guaranties for the test runners. We could also measure the consumed CPU time to make the results more reproducible but then the throughput value becomes much harder to interpret.
Also, one other related discovery: measuring process_file() may not have good enough resolution as it will execute all yara rules as well which take a non-trivial amount of time and depends on at what priority a given handler is registered at.
I had another idea in my mind before: we could measure the most important functions with some kind of tracing, and create a report based on that data. It would have the benefit of having more detailed insight in which steps contribute into the execution time. On the other hand, we could profile test execution as well to gather even finer details.
I am not sure if we should keep these large files in the repo, even if we use LFS as first checkout can take a very long time.