meio
 meio copied to clipboard
Published
20 hours ago •
 ocaml-multicore
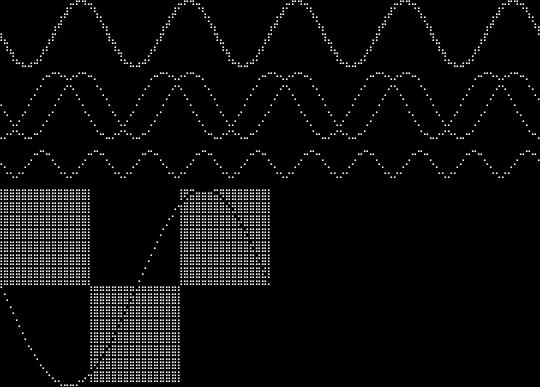
Render data as plots
It's possible to have nice graphs in the terminal using unicode braille characters.
https://github.com/asciimoo/drawille
Could be useful for:
- histograms (GC latency / taks poll time)
- evolution of memory usage
- runtime events intensity (n° of events per second)
- scheduler intensity (n° of context switches per second)
- user-provided data using well-known runtime event types (could be the included counter)