Memory not released after closing ffmpeg media objects
Operating System Info
macOS 11
Other OS
No response
OBS Studio Version
28.0.3
OBS Studio Version (Other)
No response
OBS Studio Log URL
https://obsproject.com/logs/hUD4EwRVolb4tCRP
OBS Studio Crash Log URL
No response
Expected Behavior
Like in Windows, when you switch between scenes, memory used by the previous scene is released (specially if we have all checks marked in images and videos to unload when not visible), keeping the amount of RAM used constant.
Current Behavior
In MacOS, memory is not released so, if you have an huge amount of scenes (like me), this results in insane RAM usage. With same scene collection, after switching all my scenes, in Windows I have 800MB of RAM used by OBS (constant no matter how much I navigate through scenes), in MacOS 10GB which have been increasing after each scene was loaded.
I have literally hundreds ands hundreds of elements and 100 scenes (more or less), so it's evident for me because of the huge RAM usage, but not noticeable for most users (who use a little number of scenes). I made a simpler scene collection for debugging with just a bunch of simple scenes with a media source and I uploaded that log for clarity and making simple steps to reproduce. Even with this simple setup, when you start OBS, 500MB used, and after switching scenes, about 800MB used which are never released until you change the scene collection.
Steps to Reproduce
- Create some scenes and populate them with different media sources.
- In that sources' properties, check all options about unloading the resource when not used (closing file for videos, unloading from memory for images)
- Switch between scenes
- Check RAM usage while switching scenes and see how it increases and increases. Do the same in Windows and compare.
- You can repeat the process until your computer freezes
Anything else we should know?
I was using an unofficial release of 27.1.3 for macos-arm64 and this also happened. Today I installed a clean 28.0.3 and still happens.
I see some other open reports about macos memory usage but they seemed different problems, so I opened a new one. I'm a newbie at github so my apologies if I did something wrong.
I would like to add a little extra information: this is not a memory leak. Once you navigated through all your scenes, memory stops increasing and keeps constant (can be lots of GB if you use a massive setup like me). And if you switch to another scene collection, then suddenly all memory is correctly released.
Another hint I just found. I made an experiment, I created a Mirror Source (from StreamFX plugin) which point to a scene. If you change the source the mirror points to to a new scene which wasn't loaded before, the memory usage also increases the same way I described in the issue description. I tested exactly the same in Windows (same scene collection) and doesn't happen, the memory releases as expected.
Is this virtual memory usage or resident memory usage? Using lots of memory is not necessarily a bad thing and macOS has been known to behave differently when it comes to memory management than Windows.
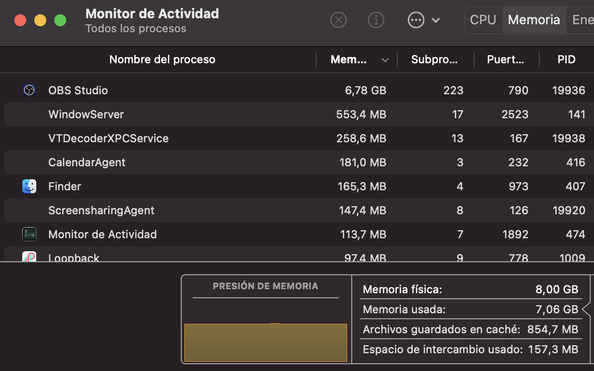
'htop' says less than 1GB resident and 399GB virtual (every process show about 390GB VIRT). Let's have a look at Process Monitor. After navigating through scenes and having allocated some GB of RAM, graph turns yellow (high memory pressure) and there are random performance drops (frequent) and/or computer freezing for some milliseconds (much less frequent), so that's why I think this is a real problem. Without these reproducible performance drops I wouldn't ever noticed it.
After closing OBS:

I understand this can be annoying, especially with complex scene collections, but to isolate the issue I'd need you to copy your scene collection, but then remove any third party plugins (I spot StreamFX and obs-ios-camera-source in your log) and associated sources from the collection.
This would help us in figuring out wether it's core functionality that already exhibits this behaviour or if it's a plugin that triggers it (which could still mean some core functionality is affected, but it'd narrow down the areas we'd need to investigate).
Of course, no problem.
I renamed Library/Application Support/obs-studio to get a "clean install". Then I recreated a simple setup with 8 scenes and simple video media sources inside them.
Log file: https://obsproject.com/logs/YrlEeMxjZfuXMzmh
In process monitor, memory allocated goes from about 550MB to 750MB after navigating through the scenes. Evidently there are no performance drops in this scale.
Looking at your log it seems that you primarily use media sources, is that right?
OBS caches video and audio frames and the more active media sources you have active in parallel, the more memory these caches will use.
It's also important to keep in mind that M1 has a unified memory architecture, which means that the figure will include GPU memory usage and video memory is managed to make full use of the available memory. Which also means that for each video you also got the generated textures being attributed to OBS.
With a discrete GPU you would not see this consumption as it would be offloaded to the graphics card and not directly reported as "memory usage" by the app itself.
Edit: A possible fix would be to use Metal textures as video caches directly (so that frames are kept in memory just once) because Unified Memory allows us to do that, alas we haven't had the resources to optimise OBS for such a new architecture (and the possibilities it brings).
Thanks for the explanation, it's very didactical! Right, I use lots of media sources and images (caring about turning on the unloading properties to free as many resources as possible) :)
My last hope: Memory is freed succesfully when changing a scene collection, instantly. So it makes me wonder if anything similar could be done to flush unused textures...
As an example, a simple setup with 4 scenes, each containing a media source playing back, I had a reported peak memory usage of about 1GB, which broke down as follows:
- About 280MB were allocated by FFmpeg's library alone (for whichever things it needs memory for)
- About 370MB were used by OBS' media thread
- Of those, about 243MB were used to cache video frames
- Another 67MB were used by FFmpeg just opening the decoder
- Preparing frames takes another 24MB of memory
- Another 13MB used by FFmpeg
- Handling the end of a video files itself also took about 10MB of memory
- Handling audio took about 8MB of memory
- Comparatively tiny: GPU memory used by OBS' renderer was much lower
- About 27MB used by the main renderer
- About 18MB for raw frame uploads
- About 7MB were used to render the previews of the video sources
- About 132MB were used to render the main interface
- 94MB were used by Qt to render the main OBS interface
- About 4MB used to render additional UI elements
- About 30MB were used to render the preview
- Another 75MB were also in use, probably by the app runtime - Instruments told me they were allocated before I attached the profiler
So the Lion's share of memory used is actually FFmpeg itself (which handles the duties of loading/decoding the media files for us) and OBS caching frames to ensure that playback is smooth.
And indeed all that memory is released when the sources are "destroyed" by OBS (e.g. by switching a scene collection):

You were right, I was seeing the memory only increased in my M1 because of shared video memory. I could reproduce the memory leak on Windows. Every new media played adds about 200/300MB in the video memory until it's full. Then it starts swapping with regular RAM. Also I reproduced the same random crashes so it's not a MacOS thing. Sadly when it hangs, it doesn't say anything on logs :( but the leakage is easily reproducible with the same steps I said before. In short, media objects don't free their resources after being closed, which is not a problem if you have a limited number of them but critical for massive setups.
EDIT: Tested also in last 29.0b3
In short, media objects don't free their resources after being closed, which is not a problem if you have a limited number of them but critical for massive setups.
close_when_inactive: no

In your log files, all but one of your Media Sources are not set to actually close the Media Source when it becomes inactive. In this case, they are not freed. By default, OBS keeps them loaded for performance reasons so that they are not constantly being reloaded. If you want the memory to be freed when they are inactive, you must enable "Close file when inactive" on each Media Source. This appears to be working as intended.