Labeling algorithms (e.g., occlusion)?
In some line plots, if the cardinality of z is relatively low, it would be nice to label the lines say at the start or end. Similarly for dot plots, it would be lovely to have an automatic labeling strategy. Related vega-label.
I really want an automatic algorithm for labeling scatterplots. And possibly stacked areas and other things. Something that considers only occlusion, like @fil/occlusion, would be a great place to start.
I also like the "halo" (white stroke clone) strategy from https://observablehq.com/@mbostock/inequality-in-american-cities and think it should be available from Plot.text (and maybe occlusion as well!).
Other refs:
- clipping the text to another mark https://github.com/observablehq/plot/issues/181
- dodge, as in https://observablehq.com/@d3/slope-chart
Here's a prototype for a labelling strategy based on @fil/occlusion https://observablehq.com/@observablehq/plot-occlusion-27
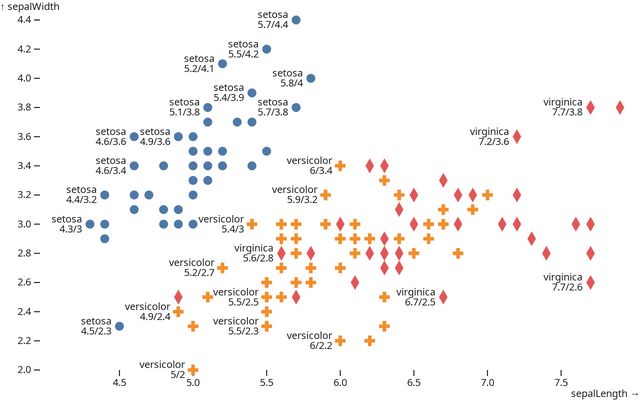
On this scatterplot, the occludeText function is able to avoid putting text on top of symbols. It's still not capable of finding a correct position to put the texts. It also needs to wait for the chart to be appended to the DOM before it can kick in, as it needs to measure the actual bounding boxes.
Can we avoid getBoundingClientRect by using the same metrics approach that Plot.text uses?
Yes it's one of the todos. Some challenges (probably not too hard):
- we'll have to compute intersections not only for text but for symbols, rects, lines, paths… (this might also be useful for interactions);
- this is yet another case where it will be useful to know in which facet we are, because the same position in two facets is not creating an occlusion.
A typical request is to limit occlusion of end-of-line labels, like in https://observablehq.com/@d3/cancer-survival-rates (unfinished Plot version: https://observablehq.com/@observablehq/plot-cancer-survival-rates). The dodgeY transform doesn't address this concern since by construction it disregards an initial y channel.
I wonder if it would be fair for the dodgeY transform to switch to a different algorithm if y is already there?
See also mapbox’s text-variable-anchor property https://docs.mapbox.com/mapbox-gl-js/example/variable-label-placement/
Another example, in which the temptation was to use dodgeY (but that's not how it works) to avoid label occlusion https://observablehq.com/d/1eb96ffa035f4676