Feature request: line profiler/performance profiler
A long and often requested feature for Numba is a JIT'd code performance profiler. The basic idea is to be able to provide feedback to users about which lines of Python source are taking the most time to execute once compiled by Numba's JIT.
This is one way to do it on the CPU:
-
Numba parses Python bytecode to it's own IR (Numba IR).
-
Numba IR has
ir.Locentries which correspond to the source lines as encoded in the byte code. -
If Numba has
debug=Trueset in thenumba.*jitdecorator then the line numbers appear in LLVM IR as part of the debug metadata and then once compiled as LNS entries in the disassembly of the JIT produced ELF object. -
Linux
perfis a tool that can be used to profile execution and works by doing event based sampling (it's a statistical profiler). perf can be run on numba.jit compiled code but the JIT compiled code need to write out a special map to describe which addresses map to which symbol names, this comes from patching LLVM. -
LLVM needs patching a bit, at present Numba uses MCJIT, applying:
- https://reviews.llvm.org/D44892
- https://reviews.llvm.org/D47343
with minor fixes to get it to compile and then adding the
LLVM_USE_PERFoption to the LLVM build makes it such thatperfand LLVM know about each other and can cooperate over these map files. -
llvmlite needs patching a bit so that function attributes can be key-word
-
From 5. frame pointer elimination needs disabling on all Numba compiled functions so that stacks are complete.
-
Once 1-6 are done it's possible to get a reasonably accurate performance annotated disassembly of the JIT ELF that ran following commands similar to those presented here: https://reviews.llvm.org/D44892
-
The problem with the performance record in 7 is that it refers to the JIT ELF which, when disassembled, looks like the (dis)assembly MCJIT produces but is not exactly the same (there's relocations/optimisations/NOP sleds etc) it also has line number missing (obviously). As a result something is needed to match up the JIT ELF disassembly with the MCJIT assembly to line up the performance information (I did this with capstone and a custom parser).
-
Once 8. is done there's a map available between:
JIT ELF disassembly -> MCJIT (dis)assembly -> LLVM IR -> Numba IR -> Python source.As there's performance information available for the bottom item in the chain it's possible to chase this through the map right up to the Python source. Practically, it makes sense to store this in a dataframe such that e.g.
.groupby(by="linenumber")can be done to trivially aggregate the performance information. -
Once 9 is done it just needs presenting reasonably.
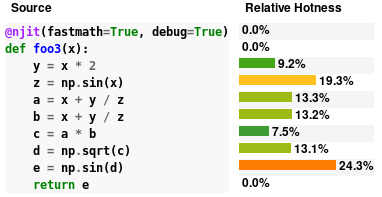
I've actually implemented a load of the above locally and have managed to produce something that seems reasonable, here's some simple output from executing a trivial function:
This is more complicated output from running numba's siphash24 replication as needed for it's CPython __str__.hash()
 and some level of drill down is possible:

Level of effort to complete this feature is unknown and potentially quite large as there are numerous dependencies in the R&D chain that should really be done first to make this easier. Namely:
- Migrate to LLVM latest
- Migrate from MCJIT to ORCJIT2 as the
perfsupport seems considerably more trodden path for that JIT engine.
There is also quite a lot of scope for work on the UI side too and it will likely be helpful to get input from those with expertise in jupyter notebooks / visualisation in general.
This work is also interlinked with:
- disassembly and inspection views for Numba compilation stages (and tracking of these with line numbers)
- CUDA profiling of the same (will open another ticket)
- Computing code coverage of JIT'd code.
Wow! 😍 The UI already looks pretty great - can't wait to be able to use it!
This looks fantastic! While I understand that it is very hard to map the optimized JIT compiled code back to the Python lines of code, I am still super excited for this feature
@seanlaw, seeing py-spy has re-ignited my interest in getting backtraces from Numba. I have a side-project that uses libunwind (so no root-privilege requirement) to get stack frames: https://github.com/numba/stacktrace. I just spent an hour trying to see if we can get further. Here's what I learnt:
Just turning on llvm frame-pointer isn't enough for dynamically generated code. Both py-spy and stacktrace cannot see the dynamic code. In stacktrace, I can see the backtrace being truncated---backtrace stops as soon as dynamic code is seen. A quick google search leads me to a similar issue in Julia (https://github.com/JuliaLang/julia/issues/3469). It mentions _U_dyn_register (http://www.nongnu.org/libunwind/man/libunwind(3).html#section_6) for registering dynamic code. I will need to try that next.
Out of curiosity, is there a way to test this out locally? I tried importing the profiler as shown but wasn't successful. I understand that this isn't released yet and I assume full responsibility for even asking but maybe you are also looking for user feedback/testing? 😊
Out of curiosity, is there a way to test this out locally? I tried importing the profiler as shown but wasn't successful. I understand that this isn't released yet and I assume full responsibility for even asking but maybe you are also looking for user feedback/testing? blush
@seanlaw I'm afraid not, it relies on a huge amount of not-even-alpha-ready code, custom LLVM and custom llvmlite, none of which are particularly easy to put into the hands of users. Once work on this can proceed I'll certainly be looking for testers and will ping you :) Thanks!
Cannot wait for the ability to profile numba code, potential even doing line profiling of it.
I am very interested in helping with this any way that I can. I'm particularly focused on using Linux perf. Line profiling is cool, but I'd even settle for a much lower bar, which is just to have the /tmp/perf-PID.map file filled out with very rough guesses at symbols. Certainly, getting it line-by-line is nice, but I'd be satisfied with less.
I'm also happy to help with debugging on real-world cases, including running the same code on a variety of CPUs I have available, and am willing to do complicated custom builds if it helps.
I came across this recent PyCon US talk regarding profiling GPU code in Python (see around the 20 minute mark):
https://www.youtube.com/watch?v=nrQPqy3YY5A
I wonder if this may be useful for numba? Their repo can be found here
very useful one! Any update on this feature? seem llvmlite has already used OrcJIT2? @stuartarchibald
I have implemented a gdb-based profiler for Numba, for more details see here: https://github.com/pythonspeed/profila
This is not as nice as what a native profiler would be able to do, but I hope it's useful; if anyone's interested, please try it out and let me know if it works!
Thanks for sharing this @itamarst, that's an interesting approach to obtaining a statistical profile, I imagine it would be sufficient for quite a few cases. Have you tested it against something like perf to see how accurate it is? I also wonder what the maximum interrupt frequency is?
very useful one! Any update on this feature? seem llvmlite has already used OrcJIT2? @stuartarchibald
@dlee992 unfortunately migrating Numba to use OrcJIT is quite involved. Exposing it through an interface in llvmlite is a step in the right direction, but a lot of work remains.