tikzplotlib

tikzplotlib copied to clipboard
Patches not present and title on the wrong location
Neither the label patches with their label, nor the axis title is present in the output .tex file.
I think the former is related to #467, regarding the latter, the title itself is present within the output but located at the very bottom left corner at (1,1) and thus not visible or misplaced.
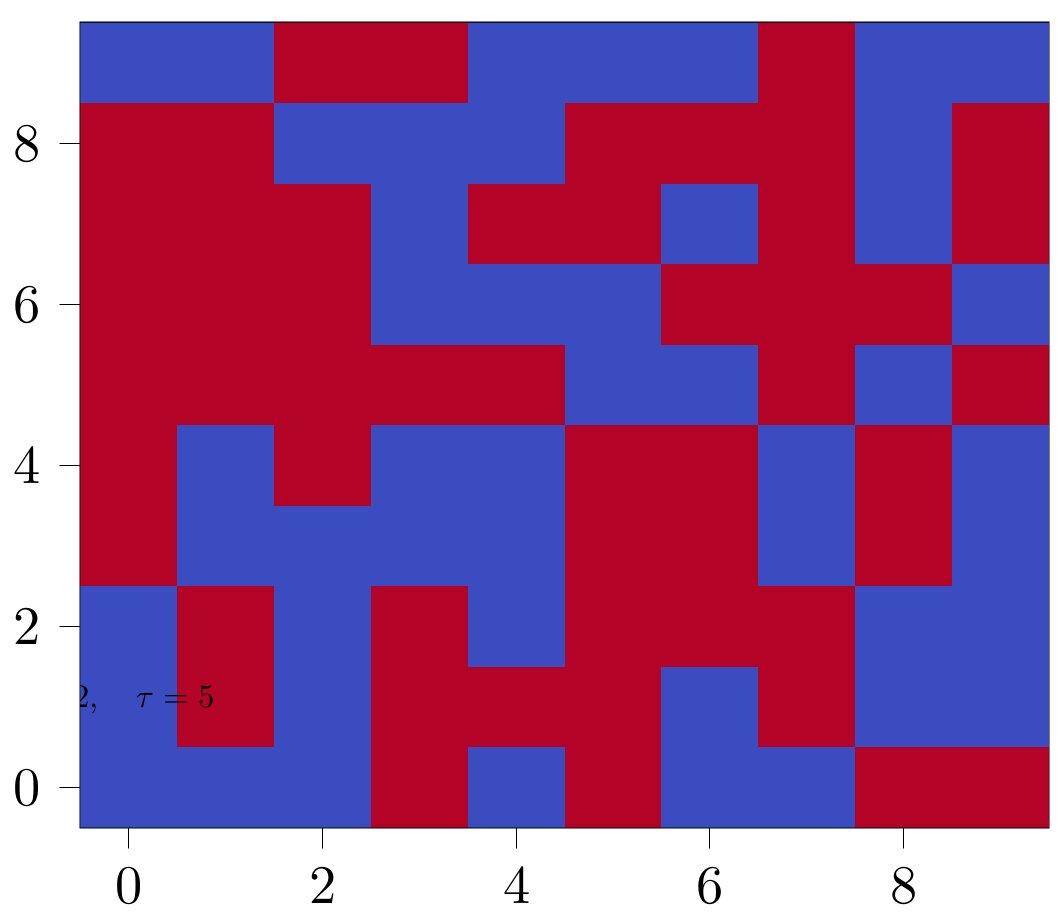
MWE
Z = np.random.randint(0,2,size=(10,10))

fig, ax = plt.subplots(figsize=(9,9))

im = ax.imshow(Z,origin='lower',cmap='coolwarm')

colors = [ im.cmap(im.norm(v)) for v in [0,1]]

patches = [ mpatches.Patch(color=colors[ll], label=l ) for ll, l in enumerate(['Label 1', 'Label 2']) ]

ax.legend(handles=patches, bbox_to_anchor=(0, 1), loc='lower left', borderaxespad=0.1, frameon=False)

ax.set_title('My Title\n'+r'$\chi = 2, \quad \tau = 5$', loc='right')

plt.tight_layout()
# fig.savefig('bug.svg')
tikzplotlib.save('bug.tex')
bug.svg

bug.tex
% This file was created with tikzplotlib v0.10.1.
\begin{tikzpicture}

\definecolor{darkgray176}{RGB}{176,176,176}

\begin{axis}[
legend cell align={left},
legend style={
  fill opacity=0.8,
  draw opacity=1,
  text opacity=1,
  at={(0,1)},
  anchor=south west,
  draw=none
},
tick align=outside,
tick pos=left,
x grid style={darkgray176},
xmin=-0.5, xmax=9.5,
xtick style={color=black},
xtick={-2,0,2,4,6,8,10},
xticklabels={
  \(\displaystyle {\ensuremath{-}2}\),
  \(\displaystyle {0}\),
  \(\displaystyle {2}\),
  \(\displaystyle {4}\),
  \(\displaystyle {6}\),
  \(\displaystyle {8}\),
  \(\displaystyle {10}\)
},
y grid style={darkgray176},
ymin=-0.5, ymax=9.5,
ytick style={color=black},
ytick={-2,0,2,4,6,8,10},
yticklabels={
  \(\displaystyle {\ensuremath{-}2}\),
  \(\displaystyle {0}\),
  \(\displaystyle {2}\),
  \(\displaystyle {4}\),
  \(\displaystyle {6}\),
  \(\displaystyle {8}\),
  \(\displaystyle {10}\)
}
]
\addplot graphics [includegraphics cmd=\pgfimage,xmin=-0.5, xmax=9.5, ymin=-0.5, ymax=9.5] {so-000.png};
\draw (axis cs:1,1) node[
  scale=0.6,
  anchor=base east,
  text=black,
  rotate=0.0,
  align=right
]{My Title
$\chi = 2, \quad \tau = 5$};
\end{axis}

\end{tikzpicture}
embedded within
\documentclass{scrartcl}
\usepackage{tikz,pgfplots}
\begin{document}
[...]
\end{document}