tikzplotlib
 tikzplotlib copied to clipboard
Published
20 hours ago •
 nschloe
fillbetween with start value 0 and logscale do not work together
trafficstars
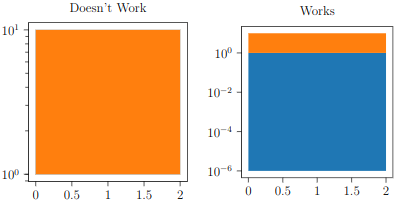
I know this is a very niche problem, but I discovered when using ax.fill_between together with ax.set_yscale("log"), a problem occurs when filling from 0 to some other number (see example below).
A workaround is simply not use 0 as the starting value, but some tiny number (see example).
# generate.py
from matplotlib import pyplot as plt
import tikzplotlib
import numpy as np
from mpl_toolkits.axes_grid1 import make_axes_locatable


RC_PARAMS = {"figure.figsize": [5, 5], "figure.dpi": 220, "pgf.rcfonts": False}


with plt.rc_context(rc=RC_PARAMS):
    fig, ax = plt.subplots(1, 1, figsize=(5, 5))
    ax.fill_between(
        np.arange(3), 0, 1
    )  # when using logscale, filling between 0 and something else does not work
    ax.fill_between(np.arange(3), 1, 10)

    ax.set_title("Doesn't Work")
    ax.set_yscale("log")
    tikzplotlib.save("test1.tikz")


plt.close()

with plt.rc_context(rc=RC_PARAMS):
    fig, ax = plt.subplots(1, 1, figsize=(5, 5))
    ax.fill_between(
        np.arange(3), 1.0e-6, 1
    )  # however, it works to just use an arbitrarily small number
    ax.fill_between(np.arange(3), 1, 10)

    ax.set_title("Works")
    ax.set_yscale("log")
    tikzplotlib.save("test2.tikz")
% standalone.tex

\documentclass[12pt, a4paper]{article}
\usepackage{subcaption}
\usepackage[latin1]{inputenc}
\usepackage[T1]{fontenc}
\usepackage[english]{babel}
\usepackage{lmodern}
\usepackage{graphicx}
\usepackage{xcolor}
\usepackage{pgf}
\usepackage{tikz,pgfplots}
\usepackage{import}
\usepackage{tikzscale, currfile}

\usepgfplotslibrary{groupplots}
\usepgfplotslibrary{dateplot}

\usetikzlibrary[pgfplots.groupplots]

\let\pgfimage\includegraphics


\begin{document}
    \centering
    \begin{figure}
        \null\hfill
        \begin{subfigure}{0.45\textwidth}
            \includegraphics[width=\textwidth]{test1.tikz}
        \end{subfigure}
        \hfill
        \begin{subfigure}{0.45\textwidth}
            \includegraphics[width=\textwidth]{test2.tikz}
        \end{subfigure}
        \hfill\null
    \end{figure}
\end{document}
% test1.tikz, can be generated with python generate.py
% This file was created by tikzplotlib v0.9.0.
\begin{tikzpicture}

\definecolor{color0}{rgb}{0.12156862745098,0.466666666666667,0.705882352941177}
\definecolor{color1}{rgb}{1,0.498039215686275,0.0549019607843137}

\begin{axis}[
log basis y={10},
tick align=outside,
tick pos=left,
title={Doesn't Work},
x grid style={white!69.0196078431373!black},
xmin=-0.1, xmax=2.1,
xtick style={color=black},
y grid style={white!69.0196078431373!black},
ymin=0.891250938133746, ymax=11.2201845430196,
ymode=log,
ytick style={color=black}
]
\path [fill=color0]
(axis cs:0,1)
--(axis cs:0,0)
--(axis cs:1,0)
--(axis cs:2,0)
--(axis cs:2,1)
--(axis cs:2,1)
--(axis cs:1,1)
--(axis cs:0,1)
--cycle;

\path [fill=color1]
(axis cs:0,10)
--(axis cs:0,1)
--(axis cs:1,1)
--(axis cs:2,1)
--(axis cs:2,10)
--(axis cs:2,10)
--(axis cs:1,10)
--(axis cs:0,10)
--cycle;

\end{axis}

\end{tikzpicture}
% test2.tikz, can be generated with python generate.py
% This file was created by tikzplotlib v0.9.0.
\begin{tikzpicture}

\definecolor{color0}{rgb}{0.12156862745098,0.466666666666667,0.705882352941177}
\definecolor{color1}{rgb}{1,0.498039215686275,0.0549019607843137}

\begin{axis}[
log basis y={10},
tick align=outside,
tick pos=left,
title={Doesn't Work},
x grid style={white!69.0196078431373!black},
xmin=-0.1, xmax=2.1,
xtick style={color=black},
y grid style={white!69.0196078431373!black},
ymin=0.891250938133746, ymax=11.2201845430196,
ymode=log,
ytick style={color=black}
]
\path [fill=color0]
(axis cs:0,1)
--(axis cs:0,0)
--(axis cs:1,0)
--(axis cs:2,0)
--(axis cs:2,1)
--(axis cs:2,1)
--(axis cs:1,1)
--(axis cs:0,1)
--cycle;

\path [fill=color1]
(axis cs:0,10)
--(axis cs:0,1)
--(axis cs:1,1)
--(axis cs:2,1)
--(axis cs:2,10)
--(axis cs:2,10)
--(axis cs:1,10)
--(axis cs:0,10)
--cycle;

\end{axis}

\end{tikzpicture}
Output: