tikzplotlib
 tikzplotlib copied to clipboard
wrong aspect ratio and tick labels
Hi!
The save command ignores the plot properties as defined in Python, so figure size and also ticks.
Here you find the Python code:
import numpy as np
import matplotlib.pyplot as plt
import tikzplotlib


fig, axs = plt.subplots(2,1,sharex=True, figsize=(5,3))
for ax in axs:
    ax.plot(np.random.randn(10))
    ax.set_yticks([])
axs[-1].set_xticks([])
tikzplotlib.save('test.tex', figure=fig)
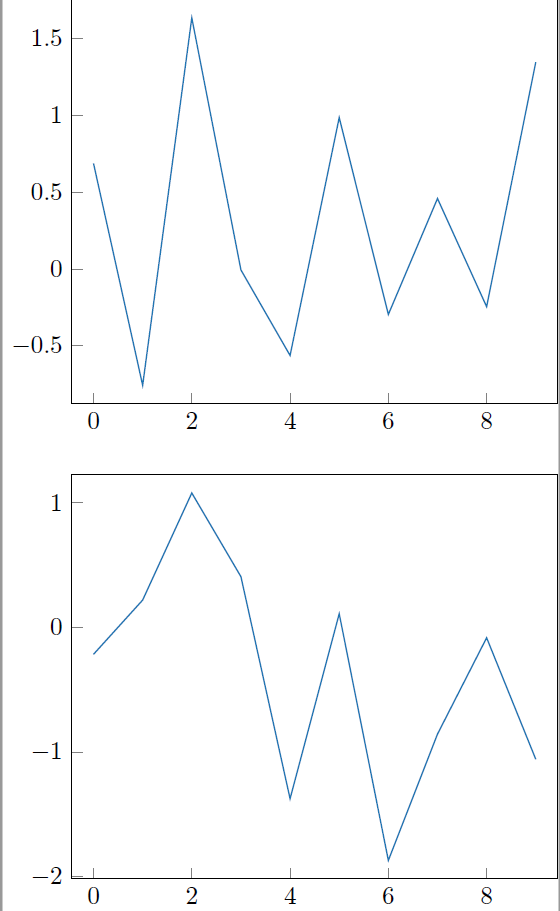
and the resulting figure:

Here you find the output (only the content in tikzpicture is the output).
\documentclass[crop,tikz]{standalone}%
\usepackage[utf8]{inputenc}
% \usepackage{fontspec} % This line only for XeLaTeX and LuaLaTeX
\usepackage{pgfplots}
\pgfplotsset{compat=newest}
\usepgfplotslibrary{groupplots}
\usepgfplotslibrary{dateplot}
\begin{document}
%% Content generated by current matplotlib2tikz %%
% This file was created by matplotlib2tikz v0.6.11.
% This file was created by tikzplotlib v0.8.7.
\begin{tikzpicture}

\definecolor{color0}{rgb}{0.12156862745098,0.466666666666667,0.705882352941177}

\begin{groupplot}[group style={group size=1 by 2}]
\nextgroupplot[
height=2cm,
tick pos=left,
width=14cm,
xmin=-0.45, xmax=9.45,
ymin=-1.0667457987895, ymax=1.64095089702875
]
\addplot [semithick, color0]
table {%
	0 0.00935854987826043
	1 -0.719459039437751
	2 -0.94366867625231
	3 1.51787377449156
	4 -0.268011939635513
	5 0.432507424003117
	6 0.256035115726765
	7 0.589755566433388
	8 0.169612376174995
	9 0.360006413025518
};

\nextgroupplot[
height=2cm,
tick pos=left,
width=14cm,
xmin=-0.45, xmax=9.45,
ymin=-1.71186259441581, ymax=1.32451580260072
]
\addplot [semithick, color0]
table {%
	0 -0.0531891184940374
	1 -0.980461215138939
	2 1.18649860273633
	3 -1.57384539455143
	4 0.000592971627342839
	5 0.278243313001343
	6 -1.08390207108602
	7 -0.222311880703437
	8 -0.186944677313487
	9 -0.412516360530032
};
\end{groupplot}

\end{tikzpicture}

%% End matplotlib2tikz content %%
\end{document}
It looks like this:
I added the begin document etc on my own so that you can compile it. I was not able to use standalone, because this line
tikzplotlib.save('test.tex', figure=fig, standalone=True)
gives the following error:
---------------------------------------------------------------------------
UnicodeEncodeError                        Traceback (most recent call last)
<ipython-input-21-9f8ff2aa275c> in <module>
      9     ax.set_yticks([])
     10 axs[-1].set_xticks([])
---> 11 tikzplotlib.save('test.tex', figure=fig, standalone=True)

~\Anaconda3\lib\site-packages\tikzplotlib\_save.py in save(filepath, encoding, *args, **kwargs)
    253     code = get_tikz_code(*args, filepath=filepath, **kwargs)
    254     file_handle = codecs.open(filepath, "w", encoding)
--> 255     file_handle.write(code)
    256     file_handle.close()
    257     return

~\Anaconda3\lib\encodings\cp1252.py in encode(self, input, final)
     17 class IncrementalEncoder(codecs.IncrementalEncoder):
     18     def encode(self, input, final=False):
---> 19         return codecs.charmap_encode(input,self.errors,encoding_table)[0]
     20
     21 class IncrementalDecoder(codecs.IncrementalDecoder):

UnicodeEncodeError: 'charmap' codec can't encode character '\u2212' in position 204: character maps to <undefined>
I expect that the created PDF looks as the Python image, thus having no labels and also keeping the ratio the same.
Thank you.
Workaround for standalone is to enforce UTF-8 encoding like
tikzplotlib.save('test.tex', figure=fig, standalone=True, encoding='utf-8')
Figure size is IMHO deliberately not set in tex code per default, as it provides great flexibility later on by setting figure size in tex code via \pgfplotset. However, you can use figurewidth and figureheight arguments of tikzplotlib.save (help is in tikzplotlib.get_tikz_code) to include the size during exporting.
Hi,
thank you for the help with standalone, this works now! :)
But it seems like the ratio thing is not working when having several subfigures. In Python, the figure size is for the whole figure, but giving this ratio in the save command, it is applied to every single figure. This makes it very difficult to find the appropriate ratio, since every time a tex file must be compiled to see the result...
Python Output:
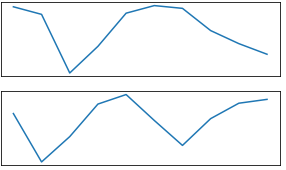
Tex Output:
\documentclass{standalone}
\usepackage[utf8]{inputenc}
\usepackage{pgfplots}
\usepgfplotslibrary{groupplots}
\usepgfplotslibrary{dateplot}
\pgfplotsset{compat=newest}
\DeclareUnicodeCharacter{2212}{−}
\begin{document}
% This file was created by tikzplotlib v0.8.7.
\begin{tikzpicture}

\definecolor{color0}{rgb}{0.12156862745098,0.466666666666667,0.705882352941177}

\begin{groupplot}[group style={group size=1 by 2}]
\nextgroupplot[
height=3cm,
tick pos=left,
width=5cm,
xmin=-0.45, xmax=9.45,
ymin=-2.29312259958036, ymax=0.598167553081616
]
\addplot [semithick, color0]
table {%
0 0.420332916554586
1 0.124344978817836
2 -2.16170031991391
3 -1.12272321848642
4 0.170758559241216
5 0.466745273415162
6 0.358909460764393
7 -0.508203349860191
8 -1.0171349728485
9 -1.43107206064977
};

\nextgroupplot[
height=3cm,
tick pos=left,
width=5cm,
xmin=-0.45, xmax=9.45,
ymin=-1.325367396604, ymax=2.11047929382579
]
\addplot [semithick, color0]
table {%
0 1.07358466436871
1 -1.16919254703901
2 0.00457702224023444
3 1.5129165478777
4 1.9543044442608
5 0.753158307772239
6 -0.403602247044528
7 0.837817543312343
8 1.55238969910141
9 1.73038635583569
};
\end{groupplot}

\end{tikzpicture}

\end{document}

And still my problem is, that the labels are removed in Python but not in the tikz grafic.
It's more or less possible to work around these issues:
import numpy as np
import matplotlib.pyplot as plt
import tikzplotlib

fig, axes = plt.subplots(2,1, sharex=True, figsize=(5,3))
for ax in axes:
    ax.plot(np.random.randn(10))
    # ax.set_yticks([])
    ax.set_yticklabels([' '])
    ax.yaxis.set_ticks_position('none')
    ax.set_xticklabels([' '])
    ax.xaxis.set_ticks_position('none')
# axs[-1].set_xticks([])
tikzplotlib.save(
    'test.tex', figure=fig,
    extra_axis_parameters={'width=\\figwidth', 'height=\\figheight'},
)
And then in your tex document just make sure to define the macros that were inserted into the axis parameters:
\providecommand{\figheight}{2in}%
\providecommand{\figwidth}{6in}%
\input{figdirectory/test}%
In fine, using ax.set_yticklabels([' ']) and ax.yaxis.set_ticks_position('none') (rather than ax.set_yticks([])) effectively wipes out the y ticks and their labels in both matplotlib and the pgfplot; and the figure sizes can be adjusted post hoc.