tikzplotlib
 tikzplotlib copied to clipboard
Ticks Issue
Hi,
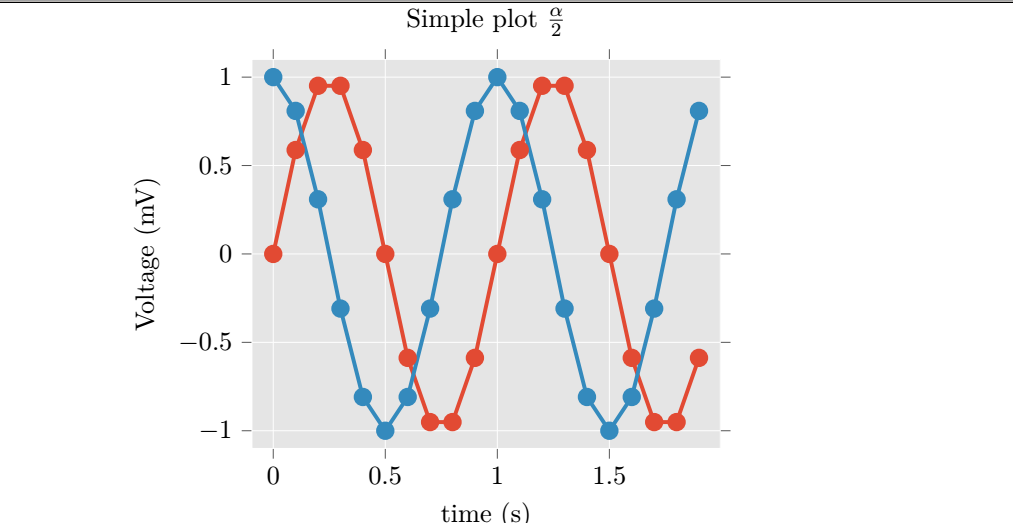
I executed the exact same example code given in the manual and rendered the picture in Latex. However, the outcome differs. The axis ticks are shown outside the plot and on all 4 edges, which looks silly.
I run the Python plot on python 3.7 and use TexMaker for editing the Latex file. Any leads?
For reference:
You want
xtick pos=bottom, ytick pos=left, or alternativelytick pos=leftwhich does the same thing. The length of the ticks is defined by thetickwidthparameter.
https://tex.stackexchange.com/questions/387611/pgfplots-remove-tickmarks-on-right-and-top-of-plot?rq=1
I've tried reproducing this on two different machines, but had no success. Perhaps there's nonstandard matplotlibrc config on your machine.